For two and a half years... I did a lot of manual work, but I discovered a new world!
5.0
wjdwlrn123
100% enrolled
This was a really good lecture. I think I can apply it directly to my work. Thank you.
5.0
poongak
64% enrolled
Han River I always prayed for gratitude when I saw the Han River. I regret that I didn't see this lecture until now. If I hadn't seen this lecture, I wouldn't have said that I knew Excel. I think this is the easiest and most practical Power Query lecture I've ever seen. I sincerely thank you.
What you will gain after the course
1. Data processing with Power Query
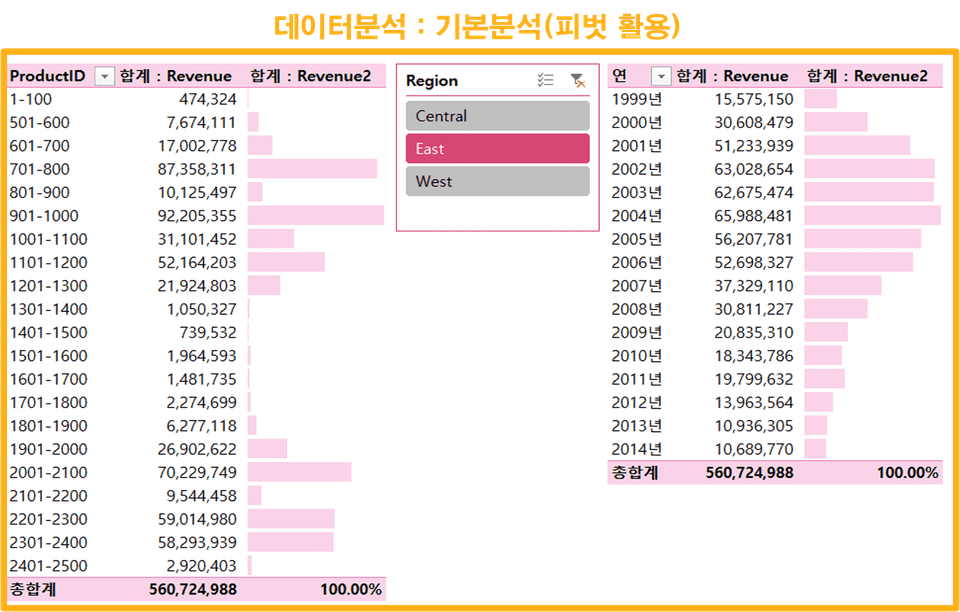
2. Analyze and visualize with pivots using the hottest methods
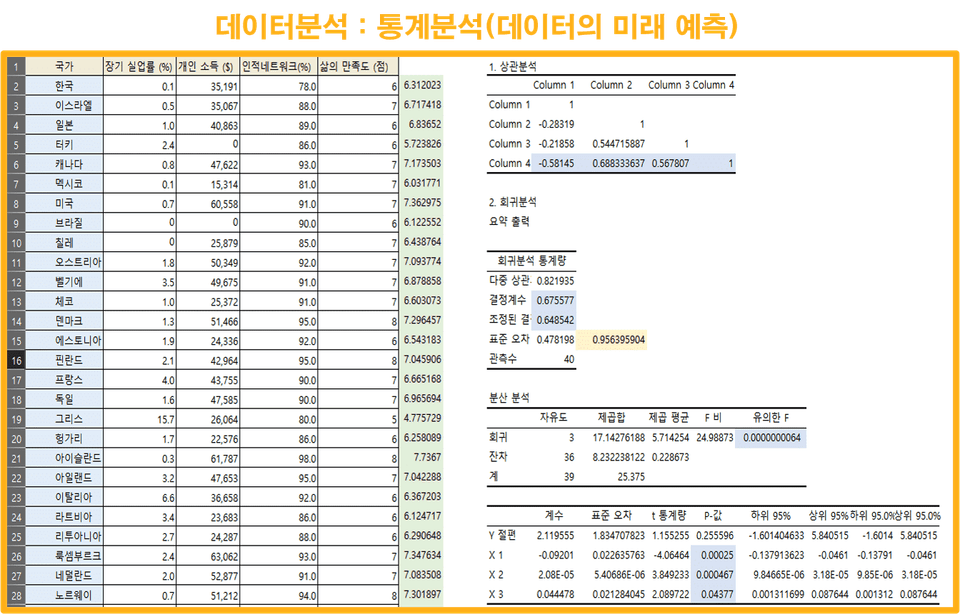
3. Process of predicting the future of data using regression analysis
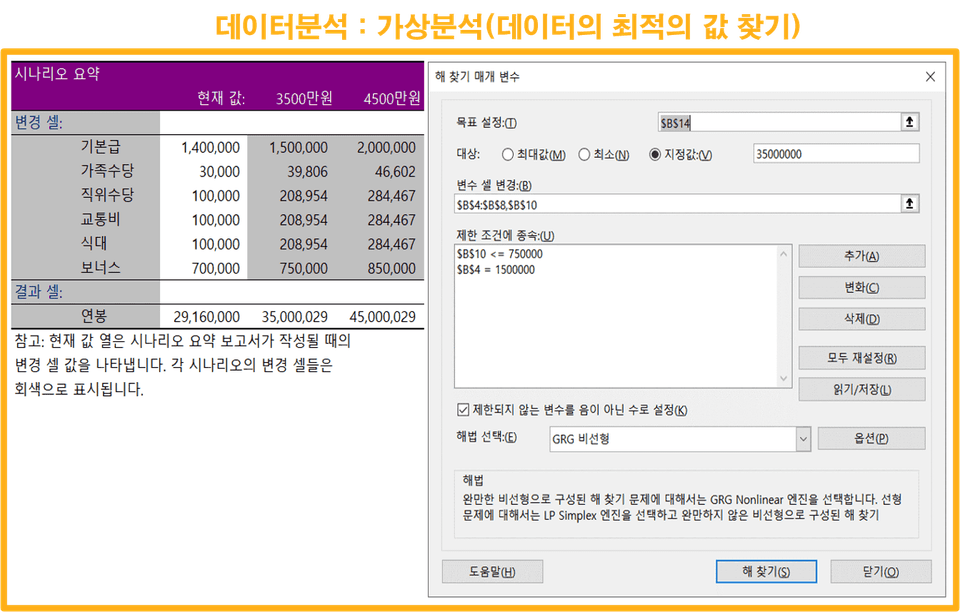
4. Scientific method to find optimal values for data
A specialized data processing tool that is much easier and more sophisticated than Vlookup. Learn “Power Query” and become a successful person!
Do you know the differences between Excel of the past and today's Excel? Previously, joining data often involved tedious copy-and-paste or Vlookups. However, this often resulted in lag and inconveniences when using large amounts of data. To address this, Excel has added Power Query, a specialized data extraction feature .
1 What is Power Query?
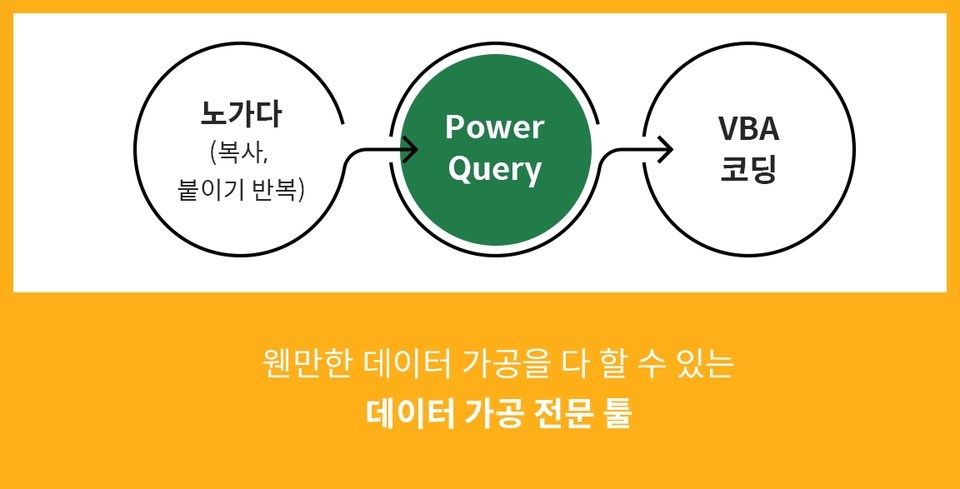
PowerQuery is a feature that allows Excel to use the "query" data extraction function, previously used in Microsoft Access. Simply put, it's a specialized data processing tool that sits between Nogada and VBA, capable of handling most data processing tasks.
By simply checking the Ribbon menu > Developer Tools (Options - Customize Ribbon - Developer Tools...check) > Excel Add-ins > Analysis ToolPak, Solver checkbox, you can use almost all of the specialized analysis functions available in specialized statistical analysis tools in a general-purpose Excel program. Of course, the results are the same. Wouldn't you like to learn PowerQuery, which allows you to easily use specialized analysis functions?
2 Reasons why Power Query is efficient and good!
1. When compiling and reporting monthly data, it's necessary to first consolidate data from numerous Excel files within a specific folder. Here are the differences between the old and new Excel versions:
Existing Excel
Power Query (Latest Excel)
- No file collation or sheet collation function - Problem solving with hard work ( copying , pasting ) orVBA coding
- Because Power Query is provided as a menu Consolidate files and sheets in one click - If the original data changes , Just click the ' Refresh ' button to automatically update
2. In the field, we often use the Vlookup function to join data. At this time, the differences between the old Excel and the new Excel are as follows.
Existing Excel
Power Query (Latest Excel)
- Vlookup function that is widely used in the field When using , if there is a lot of data, the processing speed decreases. - If the linked original data is moved or lost An error occurred in the file set for the Vlookup function.
-Data join is performed in a single click with the menu. Provides a menu that can respond to movement and loss of linked source data.
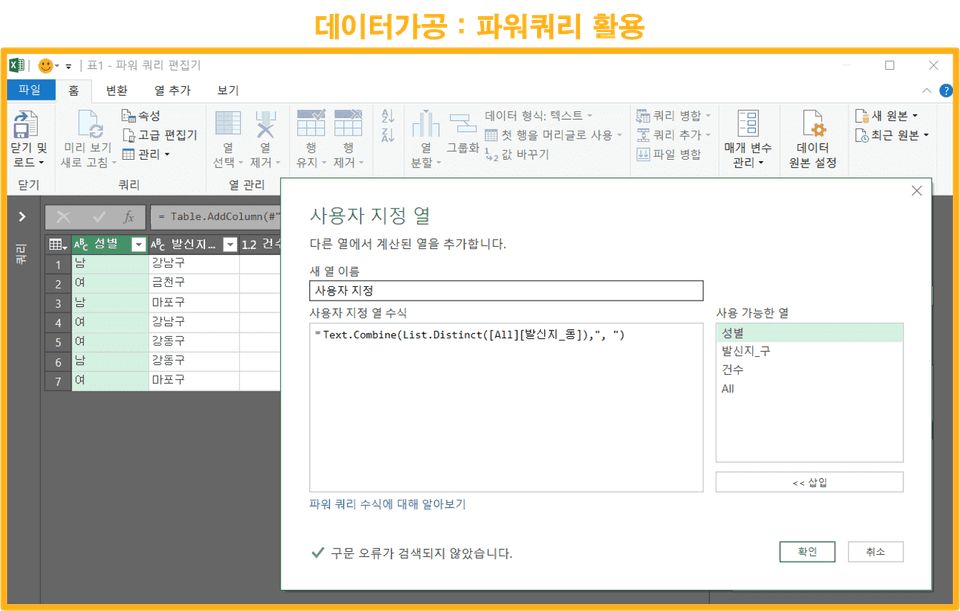
3. In addition, you can cleanly retrieve web data and extract text without using functions. You can easily perform complex data processing, such as data formatting and complementing the shortcomings of pivot tables.
3. This course's unique strengths
Presenting Excel's most trendy data processing and analysis skills!
Until now, predicting future data values was generally considered a task limited to those skilled in specialized statistical analysis tools (SAS, R, MINITAP, etc.). While Excel power users may be aware of this feature, it's designed based on statistics, requiring basic statistical knowledge to interpret the results. This knowledge is rare among general users. This course provides basic statistical knowledge so that you can flexibly apply Excel's statistically based 'analysis' function to your work, and helps you understand and apply it easily through practical examples .
4 What you will learn in this lecture
Learn how to process structured and unstructured data from the workplace using Excel's Power Query, a Business Intelligence Platform.
Leverage slicers, pivot table linking, and conditional formatting to create stunning visualizations of aggregated pivots, and automatically refresh pivot tables with a little VBA code.
Excel's statistical analysis features, designed based on statistical models, allow you to grasp data properties at a glance with descriptive statistics and scientifically predict future data with regression analysis. Through this course, you can easily master the fundamentals of statistics and write scientific reports .
Finding the optimal combination of data is easy to understand and can be applied in practice. The Solver function helps you find the optimal combination of data with limited resources in the business world.
Recommended for these people
Who is this course right for?
1. Those who are looking for a way to process data in an easier and more scientific way, rather than using manual labor and VBA.
2. Those who want to learn various practical cases of Power Query
3. I heard that advanced analysis is possible with Excel, but how far can it go? Or how much can I trust the results?
4. Those who want to see the ultimate in Excel data analysis
Those hours of manual work are never in vain.
Through those hours, you have accumulated a lot of tacit knowledge that cannot be expressed in text,
and you have established thorough motivation and direction for efficient handling of data.
You have already become a power user who cares for your colleagues!!!
Thank you♡
Stay healthy~
Hope
I was able to learn the big flow of data collection, processing, and analysis in Excel all at once. I was able to complete the course in a short period of time because the vast content was explained logically and easily. I regret not knowing this course early in my career, but I think I can apply it very usefully in my field now that I know about it. Lastly, I would like to thank the instructor who taught me with a considerate attitude toward colleagues, not just learning simple Excel skills. :)
It seems like you have the ability to look at Excel with insight.
I can picture you absorbing and learning like a sponge.
You are an Excel Data Scientist who is considerate of your colleagues and moving forward in the field!
Thank you.
Stay healthy.
Hope you have a good day
Han River I always prayed for gratitude when I saw the Han River. I regret that I didn't see this lecture until now. If I hadn't seen this lecture, I wouldn't have said that I knew Excel. I think this is the easiest and most practical Power Query lecture I've ever seen. I sincerely thank you.
I came across this class while working on a Power BI introduction project and learned that Power Query comes first, and it was a more useful class than I imagined! I know you also run a YouTube channel, so if you upload a useful M function combination section on YouTube, I will take the class regularly ^^ Thank you!!
Thank you for your hard work :D
Ah.. your company is introducing Power BI to work.
I think it's a good direction.
As you said, we are planning a Power Query Advanced curriculum.
I don't know exactly when it will be,
but I hope it will be opened soon.
Thank you~
Hope


![[First in Korea] ChatGPT × Word Practical Applications: Document Automation for EveryoneCourse Thumbnail](https://cdn.inflearn.com/public/files/courses/338227/cover/01k0rxg0k0xk9q6vefywa4qnbn?w=420)

![[Pass ITQ Excel A in One Go] in 3 daysCourse Thumbnail](https://cdn.inflearn.com/public/courses/329652/cover/b44e11b6-a47e-4993-86ea-a85da9836bb5/329652-eng.png?w=420)