NJ's Survival Kit
NJ Namju Lee
This series is a compilation of videos that I have listened to, learned, and felt. It can provide you with a variety of perspectives on your life journey.
입문
Portfolio
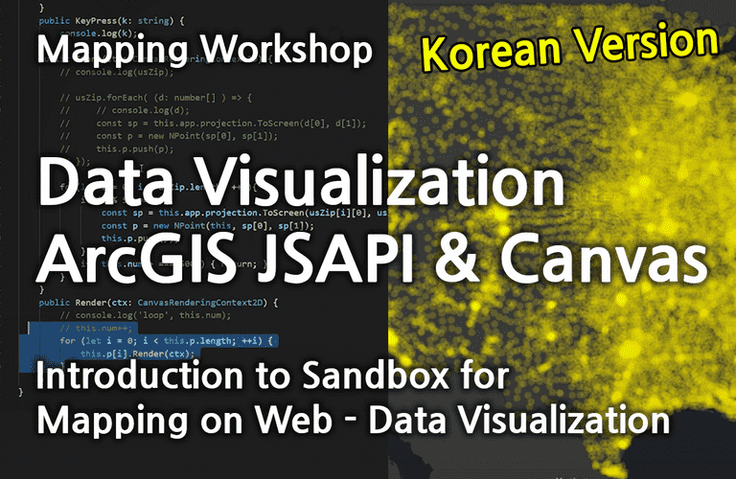
Learn how to map GIS (Geographic Information System) data through our Digital Mapping Workshop. Create your own digital mapping tool, including how to visualize your data on Canvas.
849 learners
Level Basic
Course period Unlimited

You can map GIS data
You can visualize data on Canvas.
You can do interactive visualizations
Typescript
HTML Canvas
ArcGIS JSAPI
Data Visualization
Have you heard of Big Data or GIS? GIS stands for Geographic Information System, which, simply put, is a data system that contains location information. How can we visualize this location-based data? Let's learn together through a digital mapping workshop!
Create your own mapping tool on the web! Learn interactive data visualization using ArcGIS's JSAPI. This course is recommended for anyone interested in creative coding, data visualization, and mapping. Learn how to utilize JSAPI, how to draw on HTML Canvas, and learn about interactive visualization and mapping! Related examples will be updated in the future.
Who is this course right for?
For those who want to visualize city information
Anyone who wants to create interactive visualization apps
For those who want to study creative coding through data
Need to know before starting?
Javascript
5,526
Learners
64
Reviews
5
Answers
4.9
Rating
6
Courses
이남주(NJ Namju Lee)는, NJSTUDIO를 2004년에 창업하여, 건축 디자인, 시각화, 및 컴퓨테이셔널 디자인 스페셜리스트로 활동해 오고 있으며, 현제, ESRI(Environmental Systems Research Institute)의 소프트웨어 엔지니어 근무하고 있습니다. 서울 과학 기술 대학교(BS), UC Berkeley(MArch), 이후, Harvard GSD (MDes)를 1st Digital Design Prize를 수상하며 졸업했습니다. 연구원으로서, 시드니 공과 대학 (UTS)의 UrbanAid Lab, 매사추세츠 공과 대학 (MIT)의 SENSEable City Lab 및 Media Lab (Changing Places Group), UC Berkeley의 환경 디자인 대학에서 연구원으로 근무했습니다.
Harvard GSD, MIT, NYIT 및 국제 콘퍼런스에서, 컴퓨테이셔널 디자인, 매핑, 데이터 프로세스 및 시각화에 대해서 수업을 하였습니다. 대한민국 노동부, 오토 데스크(Autodesk) 코리아 등 한국의 여러 대학에서 수업을 하였으며, 건축 시각화 및 디지털 디자인 스튜디오 I, II를 가르쳤습니다. 'Simulation & Visualization of Architecture'를 출판했고, 건축 및 그래픽 메거진에 기고했습니다. 서울, 미국, 호주 및 중국에서, 학제 전시회, 디지털 영화 작업, 건축 디자인 및 컴퓨테이셔널 작업에 참여했습니다. 시각화 전문가로서 KPF, HYUNDAI, SAMSUNG, SK, 그리고 posco E & C 등과 협력하였습니다.
컴퓨테이셔널 디자인 및 데이터 프로세스와 시각화를 중점으로, 건축 환경 및 기술의 통합을 다양한 영역에서, 프로젝트를 담당해오고 있습니다. 업무의 중심은 데이터를 활용한 통합 디자인 프로세스를 연구, 적용 및 교육 활동을 해오고 있습니다.
All
4 lectures ∙ (1hr 10min)
All
10 reviews
4.9
10 reviews
Reviews 6
∙
Average Rating 5.0
Reviews 97
∙
Average Rating 4.2
Reviews 5
∙
Average Rating 5.0
Reviews 50
∙
Average Rating 4.8
Free
Check out other courses by the instructor!
Explore other courses in the same field!