NJ's Survival Kit
NJ Namju Lee
Free
Beginner / Portfolio
4.9
(14)
400+
This series is a compilation of videos that I have listened to, learned, and felt. It can provide you with a variety of perspectives on your life journey.
Beginner
Portfolio
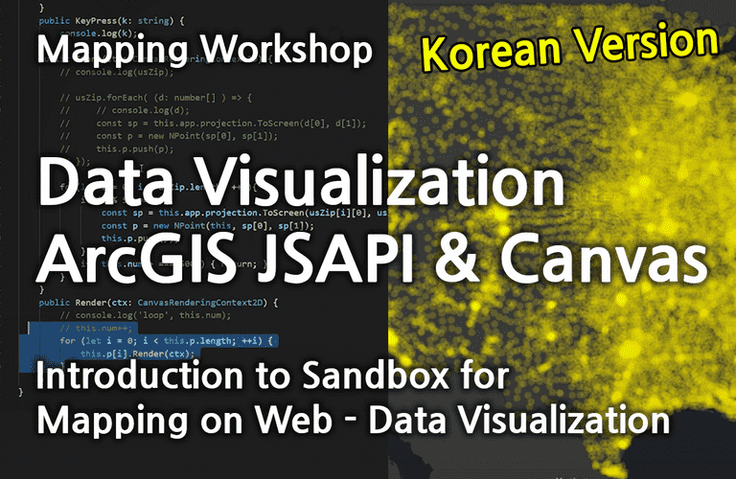
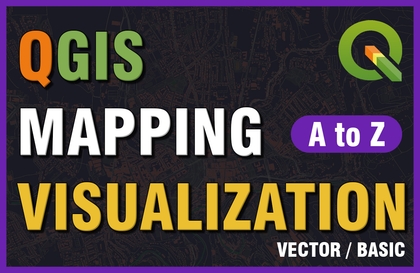
Learn how to map GIS (Geographic Information System) data through our Digital Mapping Workshop. Create your own digital mapping tool, including how to visualize your data on Canvas.
876 learners
Level Basic
Course period Unlimited
Reviews from Early Learners
5.0
윤미최
Free lecture
5.0
누팍
Thank you for the great lecture :)
5.0
동해물과백두산이마르고닳도록
I like how you can leverage your data
You can map GIS data
You can visualize data on Canvas.
You can do interactive visualizations
Typescript
HTML Canvas
ArcGIS JSAPI
Data Visualization
Have you heard of Big Data or GIS? GIS stands for Geographic Information System, which, simply put, is a data system that contains location information. How can we visualize this location-based data? Let's learn together through a digital mapping workshop!
Create your own mapping tool on the web! Learn interactive data visualization using ArcGIS's JSAPI. This course is recommended for anyone interested in creative coding, data visualization, and mapping. Learn how to utilize JSAPI, how to draw on HTML Canvas, and learn about interactive visualization and mapping! Related examples will be updated in the future.
Who is this course right for?
For those who want to visualize city information
Anyone who wants to create interactive visualization apps
For those who want to study creative coding through data
Need to know before starting?
Javascript
5,643
Learners
66
Reviews
5
Answers
4.9
Rating
6
Courses
NJ Namju Lee founded NJSTUDIO in 2004 and has been active as an architectural design, visualization, and computational design specialist. He currently works as a software engineer at ESRI (Environmental Systems Research Institute). He graduated from Seoul National University of Science and Technology (BS), UC Berkeley (MArch), and Harvard GSD (MDes), where he was awarded the 1st Digital Design Prize. As a researcher, he has worked at the UrbanAid Lab at the University of Technology Sydney (UTS), the SENSEable City Lab and Media Lab (Changing Places Group) at the Massachusetts Institute of Technology (MIT), and the College of Environmental Design at UC Berkeley.
I have taught computational design, mapping, data processing, and visualization at Harvard GSD, MIT, NYIT, and various international conferences. I have also lectured at several universities in South Korea, including the Ministry of Employment and Labor and Autodesk Korea, where I taught Architectural Visualization and Digital Design Studio I and II. I authored 'Simulation & Visualization of Architecture' and have contributed to various architecture and graphics magazines. I have participated in interdisciplinary exhibitions, digital film projects, architectural design, and computational work across Seoul, the USA, Australia, and China. As a visualization expert, I have collaborated with KPF, HYUNDAI, SAMSUNG, SK, and POSCO E&C.
I have been leading projects across various fields, focusing on computational design, data processes, and visualization, while integrating the built environment and technology. My work primarily centers on researching, applying, and teaching integrated design processes utilizing data.
All
4 lectures ∙ (1hr 10min)
All
10 reviews
4.9
10 reviews
Reviews 5
∙
Average Rating 5.0
Reviews 1
∙
Average Rating 5.0
5
I liked that you spoke in English terms that I usually only heard in Korean.
Thank you~~
Reviews 50
∙
Average Rating 4.8
Check out other courses by the instructor!
Explore other courses in the same field!
Free


![[D-PEC UP_PASS] Data Architecture Semi-Professional (DAsP)_Updates in progress until 04/30Course Thumbnail](https://cdn.inflearn.com/public/files/courses/333571/cover/ai/2/1a2dc349-c7f4-46e7-b0dd-d977c0dc4a0b.png?w=420)


![[Marketing Archive] Big Data-Driven Marketing StrategyCourse Thumbnail](https://cdn.inflearn.com/public/files/courses/339225/cover/01k7e89h4d1fkmcr1bwfh1j33h?w=420)