1. Types and characteristics of Excel files encountered in the workplace
2. Converting uncleared data to Power Query
3. Power Query instead of Vlookup
4. Report with a standout Dashboard
Even a newbie who is completely clueless can do his job well. Excel training course that will make you a super rookie!
👩🏻💻 What you will learn in this course
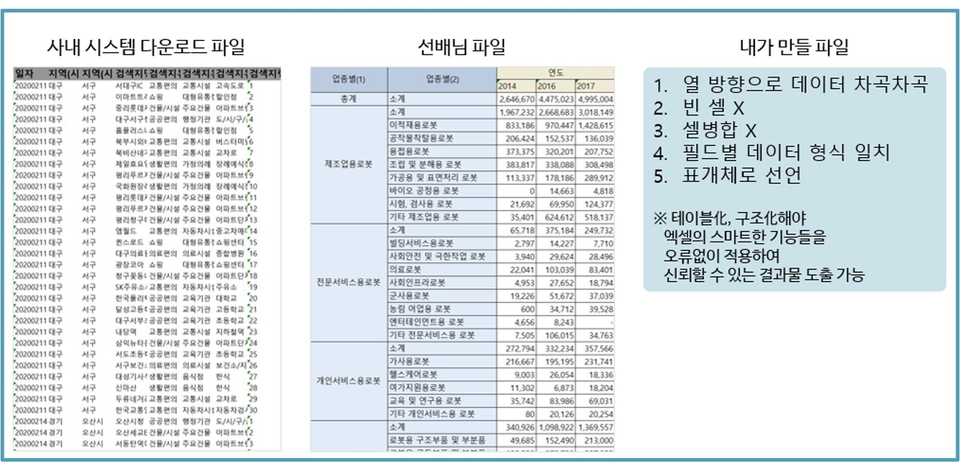
1. Understand the types and characteristics of files frequently seen in the company.
The files we have seen in the book so far are clear files that have been refined. But the Excel files you encounter after joining the company are dizzying as soon as you see them. Why does the vlookup function, which used to work so well, only return errors when applied to company files? Pivot table aggregate values sometimes come out as strange values.....😢.😢
If you know in advance the types and characteristics of Excel files you will encounter at work, When you join the company, you will be able to handle it much better :D
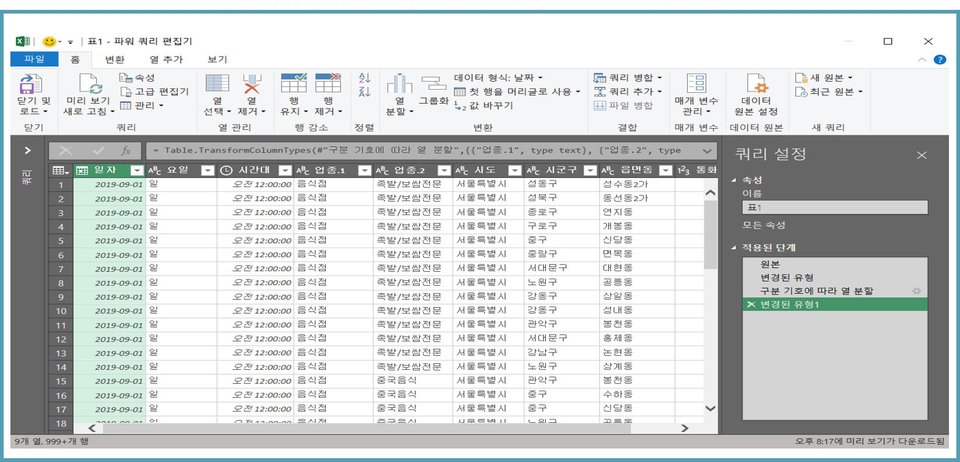
2. Converting Uncleared Data in One Go with Power Query
The biggest characteristic of the files that could not be cleared is that the data types are mixed up. To change this properly, seniors are using functions or various features of Excel. When there is a lot of data, the screen often turns white during conversion. Time is running out, Excel isn't working...
In times like this, Excel, which is evolving into a Business Intelligence Platform, has ambitiously released If you convert using 'Power Query' , you will be recognized as a '5G new employee'!!!
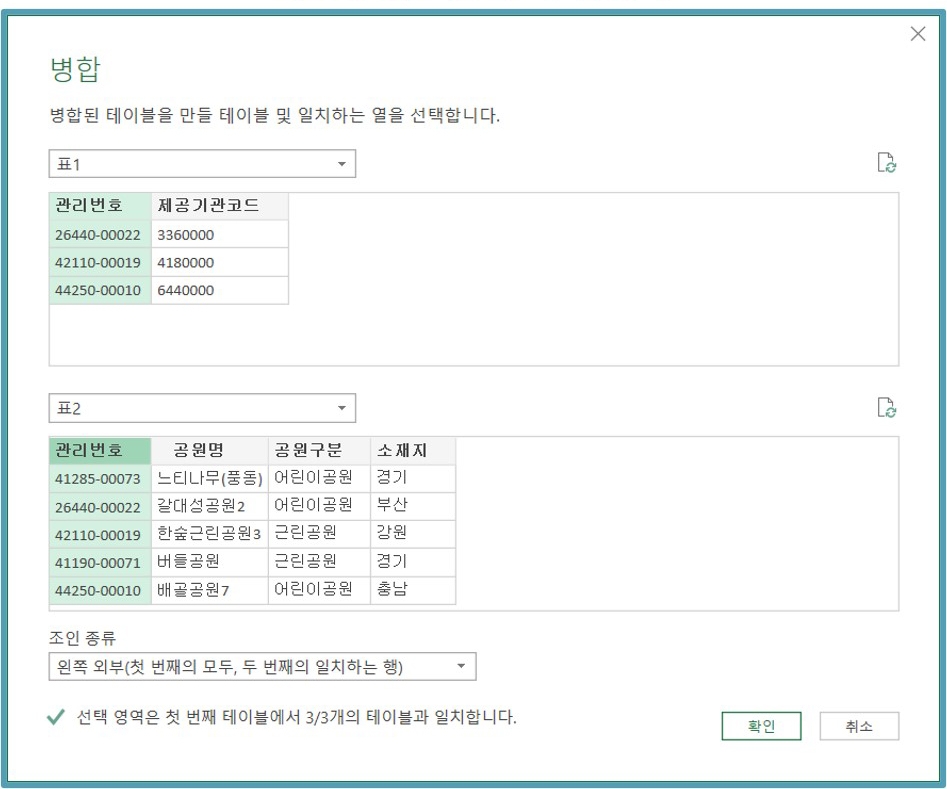
3. Use PowerQuery instead of Vlookup
What on earth can't 'Power Query' do?
As the data increases, the speed also slows down, and errors pop up even if the environment changes a little. The Vlookup function that's burning me up... I can't abandon you, it's really a love-hate relationship. But now I have to say goodbye to you. I've come across a much, much more capable Power Query.
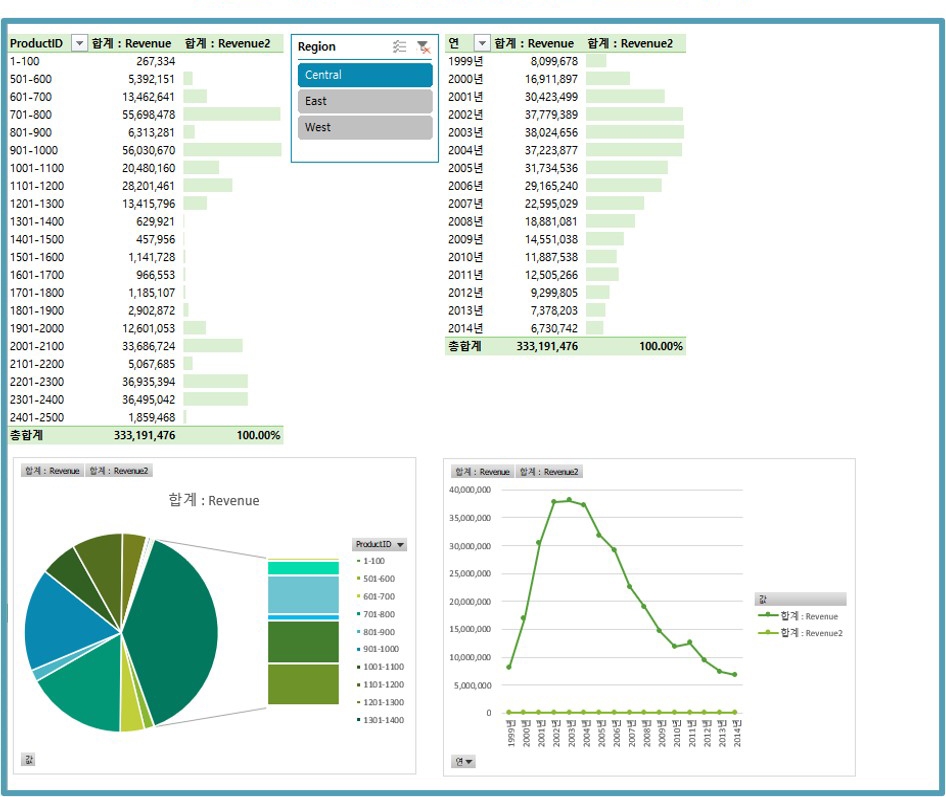
4 Reporting with a standout Dashboard
When I analyze the data and report monthly, I break out in a cold sweat...😢.😢 They ask me to create a report that is easy to read at a glance using a pivot table. After creating it with pivot, all you see is a table full of numbers.
What on earth did my friend make it out of? With just one click of a button, the table changes and the bar graph flies around???
Just use pivot + conditional formatting + slicer + pivot chart. You will become a popular new employee who is praised by your superiors .
I think it will be a great help to my work! I had a lot of concerns because I had many shortcomings when working with Excel, but thanks to this, I think I can easily learn, acquire, and apply it to my work. I think I will be able to analyze, process, and visualize any data I come across with the skills I learned this time! Thank you :)


![[2024] Power BI Basic Course for Tired Excel Users (Beginner to Intermediate)Course Thumbnail](https://cdn.inflearn.com/public/courses/333721/cover/5ded8f1c-907b-493d-85ae-2fd641384417/333721.png?w=420)


![[Basic] Even those with no coding experience can do it! Master Google Sheets task automation in 90 minutesCourse Thumbnail](https://cdn.inflearn.com/public/courses/331717/cover/a395d468-0688-4908-88c2-4d087f24d7b7/thumbnail.jpg?w=420)


![[Pass ITQ Excel A in One Go] in 3 daysCourse Thumbnail](https://cdn.inflearn.com/public/courses/329652/cover/b44e11b6-a47e-4993-86ea-a85da9836bb5/329652-eng.png?w=420)
![[Episode] Excel + Python (Basic)Course Thumbnail](https://cdn.inflearn.com/public/courses/332174/cover/4bff11a1-9859-43f4-8e17-6374ee50e6d6/332174-eng.png?w=420)