[Renewed] First-time Python Data Analysis (Easy! Learn the entire process of preprocessing, pandas, and visualization) [Data Analysis/Science Part1]
This course aims to teach data analysis beginners fundamental skills for the entire Python data analysis workflow. As an e-commerce planner and developer leveraging real-world data analysis, I crafted this for easy acquisition and immediate application of the full Python data analysis process.
The official lecture chosen by Nekarakubae as an in-house lecture! Build a foundation for Python data analysis Highly complete lecture
This course is a course to learn Python data analysis techniques . It is designed to help you learn data preprocessing, data processing through the pandas library, and the most useful latest visualization library (plotly) . It is a special course that was created with the students’ perspective in mind as much as possible, based on the experience of 80,000 lecturers over 8 years, while working in parallel with the field, and provides additional detailed materials along with the course.
This course is currently being used as an official in-house Python data analysis training course by one of the actual Nekarakubae companies.
This course is a newly renewed course for 2025, reflecting existing feedback.
How do I build a foundation in data science and data analysis?
Experience the entire process of data collection, preprocessing, and analysis (SQL/NoSQL + Python). If you want professional analysis skills, learn the Python-based technology in this course. If you are aiming to be a data analyst or scientist, we provide a roadmap that allows you to learn step by step from the beginning. (See the data analysis/science roadmap below)
We have created a video that explains in detail the entire data-related career and analysis/science process. Through this video, you can learn the data process efficiently by yourself according to your goals.
I want to try my hand at real data analysis as soon as possible!
Everyone already has basic knowledge of data analysis. You only need to know the average. The key is to quickly learn the skills to perform the entire data analysis process with Python.
From various data preprocessing to data analysis using real data We've rounded up all the key skills for professional data analytics.
Python data analysis is not a simple skill that can be mastered in one go. In order to gain skills, you need to 'get used to it', and this is more effective when you approach similar concepts from various angles and learn various application examples. For this, I will introduce the following book that I wrote that will be helpful to refer to along with this online lecture . By utilizing both media, you can become familiar with Python data analysis techniques in a shorter period of time.
Python data analysis can be very awkward at first. If you learn how to use related tools and see the real-time code execution process through online lectures, you can effectively learn the actual work methods and difficult concepts.
After easily building the basics through online lectures, you can become more familiar with the concepts and grammar by accessing other explanations and additional examples of similar grammar through books. Through this, you can develop the ability to apply Python data analysis techniques to various data.
There are many data analysis lectures, and even after taking various lectures, I still don't know!
The data field is a combination of various theories and technologies. Therefore, it is important to learn systematically. Rather than a lecture that assumes that you know all the related theories and immediately analyzes data and applies fancy machine learning and AI technologies, a lecture thatallows you to learn the theories and technologies that you need to learn one by one and practice them to build them upis more helpful.
Based on actual data analysis and domain experience from the field of Nekarakubae A lecture that systematically and step by step explains all the techniques from a beginner's perspective
I even want to participate in the kaggle competition
Kaggle competitions mainly use machine learning and AI to predict data. To learn these technologies, you must first become familiar with data analysis technologies such as pandas. This lecture covers pandas and visualization technologies, and is structured to learn machine learning and deep learning (AI) technologies step by step through a systematic roadmap. (See roadmap below)
What skills do you need for data analysis?
In the field, SQL and pandas are mainly used to analyze data. Professional data analysis requires data preprocessing, analysis, and visualization skills. For this, you can learn pandas and plotly. This course covers all the core skills required for professional data analysis with Python in the field.
How can I effectively learn data analysis skills?
Pandas has a high barrier to entry with its non-intuitive syntax and extensive functionality, requiring a lot of practice. This course is structured with this in mind:
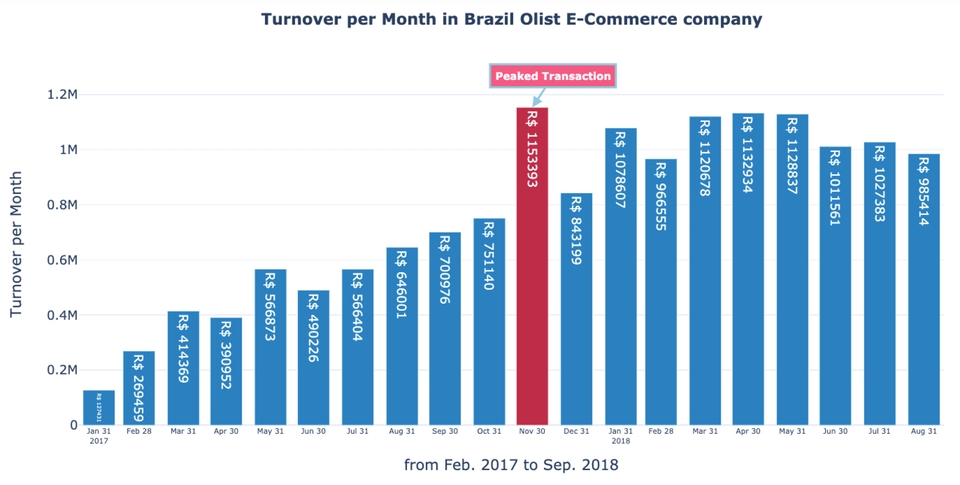
Part 1: Convert massive daily data to monthly data and learn pandas basics and preprocessing functions.
Second half: Applying EDA analysis, data analysis, and visualization (plotly) techniques to real e-commerce data
It is designed to help you become familiar with pandas and plotly in a short period of time and master the entire process of Python data analysis.
I heard that data analysis requires a good understanding of the actual business domain?
However, it is difficult to listen to a lecture that requires you to first understand various fields that you are not interested in. Try analyzing the e-commerce data covered in this lecture. Even if you do not necessarily use the term “untact era,” all businesses have been moving online in recent years. To understand online business, try understanding the most important e-commerce data. Both understanding the most helpful domain and related technologies are very helpful.
With core e-commerce data and field experience in the business domain Get a feel for data analysis and business domains!
Even if I watch the lecture, there are no materials, so do I need to buy the book as well?
We provide a concise explanation that goes beyond the limits of the book, along with actual code that you can run right away. If you watch the lecture and run the material together, it's easy to review! You can also refer to it right away whenever you need it later. (I have a lot of attachment to the material. It's a better material than the book, and the material alone makes it worth the tuition fee .)
Now, 90,000 people have verified it online and offline for 9 years. Well-organized data and clear explanations We provide better online IT courses! If you learn well, you will change!
Matplotlib is a traditional but limited data visualization technology that focuses mainly on generating static graphs. On the other hand, the latest technology, plotly, focuses on generating interactive graphs that users can interact with. It also has the advantages of excellent visual quality, web environment suitability, and more diverse graph support . So plotly is becoming more mainstream in the field. So, this lecture explains the plotly technology that is becoming mainstream as a visualization technology .
This is a helpful lecture even for those who have taken a data analysis course!
In order to make Python data analysis technology your own, you need a variety of practical exercises. This course will conduct data analysis from start to finish with various practical examples (Corona data preprocessing, e-commerce data analysis). Through this, you can improve your proficiency in related technologies and organize the knowledge you have missed.
Don't waste your time! It's not that we can't do something because we don't have the information! Learn with proven lectures!
This course has been improved upon through countless feedback over the years and was created after much thought and consideration due to my love for online lectures.
So that you can feel, 'Ah! It's really different!' This is a lecture that is created through constant thinking and improvement. Be reasonable and considerate of each other Only those who can form good relationships Please take the class!
An example of data preprocessing created by processing actual raw data in a data lecture Corona data is the most helpful example of actual pandas basic functions and preprocessing examples . Therefore, we have created the following graph for the entire period when Corona was most active, and have organized it to firmly learn the related technology.
Daily confirmed cases of coronavirus by country (including the entire period of tracking confirmed cases during the coronavirus period)
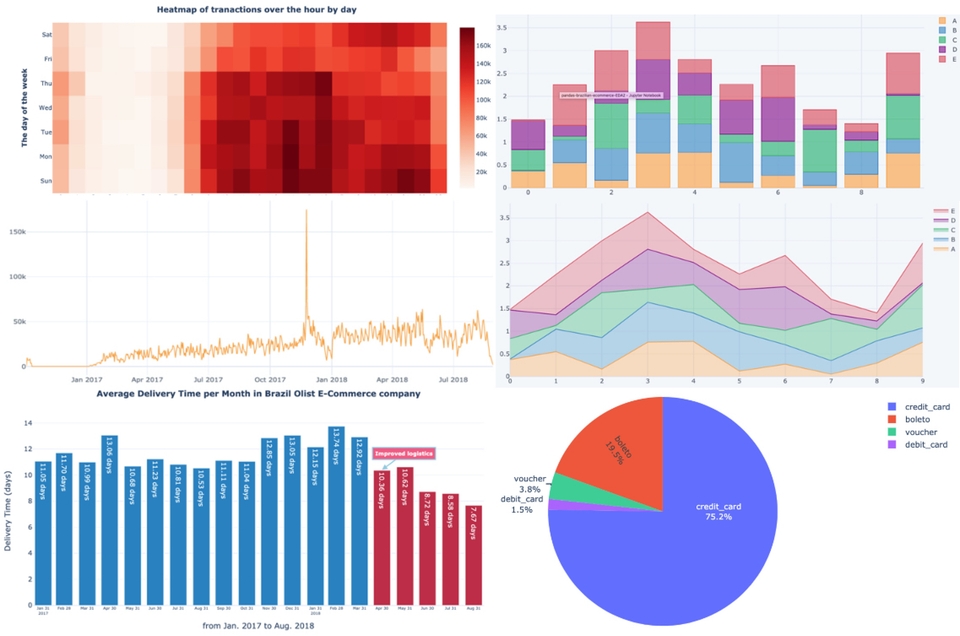
Created at the report level for actual field data analysis, including field know-how! Just drawing a graph is not enough. In the field, details are important.
Analysis of various graphs and various aspects
Learning systematically The Roadmap of Dave Lee's Residual Fun Coding 🔑
Developer, Data Analyst, and Data Scientist Career Roadmap!
From web/app development to data analysis and AI, we provide an A to Z roadmap that allows you to build a solid foundation in a short period of time. IT technologies are closely linked to each other, so they must be integrated to enable web/app services or data science. By gradually increasing the difficulty and mastering core technologies, you can learn efficiently and understand the system and data in general, and grow into a competitive developer or data expert. To this end, we have prepared a roadmap that systematically organizes core technologies in each field.
1. The fastest data-to-process roadmap
I have created a video that explains in detail about this roadmap and the entire data analysis/science process. If you refer to the video,you can easily learn the data process without trial and errorin a short period of time on your own !
Wait! ✋ Click on the roadmap below for more details. If you purchase the roadmaps all at once, they are available at a discounted price! (The discount will be reduced soon.)
2. The fastest full-stack roadmap
I have created a video that explains in detail the roadmap and the fastest way to learn and implement web/app development on your own. If you refer to this video,you can implement web/app without trial and error in a short period of time.
Wait! ✋ Click on the roadmap below for more details. If you purchase the roadmaps all at once, they are available at a discounted price! (The discount will be reduced soon.)
3. Core computer science (CS) knowledge essential in development and data fields
This roadmap is a course that systematically organizes the essential knowledge of computer engineering (CS), which is the core IT theory that is the basis of development and data fields. Among these, we are opening lectures that can systematically learn the most important core subjects such as computer structure, operating system, and network.
Recommended for these people
Who is this course right for?
Those seeking Python data analysis skills
Those who want to learn pandas and visualization techniques
Those wishing for long-term growth as data analysts
Those wanting to master data analysis skills long-term


![初めてのディープラーニングとPyTorch ブートキャンプ(簡単に!基本からChatGPT核心トランスフォーマーまで)[データ分析・科学 Part3]강의 썸네일](https://cdn.inflearn.com/public/courses/329540/cover/1be7b8cb-800f-48cb-a30c-b7d78996c075/329540-eng.png?f=avif&w=420)
![[リニューアル] Python入門とクローリング基礎ブートキャンプ [Python、ウェブ、データ理解基本まで] (アップデート)강의 썸네일](https://cdn.inflearn.com/public/courses/324082/cover/57af93de-1021-40b4-80d7-a0dfc17190cf/324082.png?f=avif&w=420)
![フルスタックのためのDockerと最新サーバー技術(Linux、nginx、AWS、HTTPS、デプロイまで) [フルスタック Part3]강의 썸네일](https://cdn.inflearn.com/public/courses/326771/cover/bc862b4d-abe6-4d80-a826-3a5324a9f998/326771-eng.png?f=avif&w=420)
![初めてのPythonバックエンドFastAPI入門 (FastAPIから非同期SQLAlchemyまで) [フルスタック Part1-2]강의 썸네일](https://cdn.inflearn.com/public/courses/333248/cover/7323d828-100e-4ac9-8e6e-0e51a17ac741/333248.png?f=avif&w=420)
![[リニューアル] はじめてのSQLとデータベース(MySQL) ブートキャンプ [入門から活用まで]강의 썸네일](https://cdn.inflearn.com/public/courses/324208/cover/85872a8e-d2bb-4c43-82fc-d55fa067746e/324208.png?f=avif&w=420)
![[リニューアル] 初めて学ぶPythonバックエンドとWeb技術入門 (Python中級、flask[フラスク]で理解するバックエンド及びWeb技術基本) [フルスタック Part1-1]강의 썸네일](https://cdn.inflearn.com/public/course-325804-cover/6afae82f-e06b-4a0b-914d-2bdf7b1f5b60?f=avif&w=420)

![[リニューアル] 初めてのPython機械学習ブートキャンプ(簡単に!実際のKaggle問題を解きながら整理する)[データ分析/科学 Part2]강의 썸네일](https://cdn.inflearn.com/public/courses/327464/cover/55c4db7b-7764-43cc-ac75-d9e8d08098f1/327464-eng.png?f=avif&w=420)
![[リニューアル] 初めてのMongoDB(モンゴDB) と NoSQL(ビッグデータ) データベース ブートキャンプ [入門から活用まで] (アップデート)강의 썸네일](https://cdn.inflearn.com/public/courses/324183/cover/fbe9f0cc-4c42-4435-b855-f283f6932415/324183.png?f=avif&w=420)

![初めてのFlutter(Flutter)基礎から実戦まで [フルスタック Part4] (簡単で堅実に段階別で多様なプロジェクトまで)강의 썸네일](https://cdn.inflearn.com/public/courses/331245/cover/1f8c5bb8-8aad-4542-b3bc-977cda51c846/331245.png?f=avif&w=420)
![フルスタックのための堅実なフロントエンドブートキャンプ (HTML, CSS, バニラJavaScript + ES6) [フルスタック Part2]강의 썸네일](https://cdn.inflearn.com/public/course-326306-cover/4ea213de-f786-4af1-a9d0-b8932263885a?f=avif&w=420)


![[Python 実戦] Web クロールとデータ分析: 世界中のサッカー選手の身価分析강의 썸네일](https://cdn.inflearn.com/public/courses/326406/cover/150871bf-bc44-4a81-a577-c957f2df0a5f?f=avif&w=420)
![[退勤後の別のこと] ビッグデータ分析技師実技 (作業型1,2,3)강의 썸네일](https://cdn.inflearn.com/public/courses/329972/cover/dcfb28fd-48c1-4bb1-ab31-d59eac874194/329972-original.png?f=avif&w=420)


