


Python Streamlit을 활용한 대시보드 만들기 (feat. 빅데이터 분석기사 실기 준비)
Evan
Python 초보자의 눈높이에 맞춰 가장 쉽고 가장 실용적인 과정으로 기획된 입문 강의로 Streamlit을 활용한 직관적인 대시보드, 배포를 위한 Google Cloud Platform 등을 배웁니다. 또한, 빅데이터 분석기사 실기 준비도 같이 할 수 있습니다.
입문
Python, streamlit, Scikit-Learn
데이터 분석 경험이 전혀 없는 비전공자, 취준생, 입문자의 눈높이에 맞춰 기획된 입문 강의로 파이썬부터 세계 최대 데이터 분석 플랫폼인 캐글에 입문 할 수 있도록 도와줍니다. 데이터 분석 커리어를 쌓아가기 위한 취업 포트폴리오까지 함께 만들어갑니다.
수강생 162명
난이도 입문
수강기한 무제한


마켓컬리
임직원들도 이 강의를 듣고 있어요!
마켓컬리
임직원들도 이 강의를 듣고 있어요!
파이썬
캐글
데이터 사이언스
데이터 분석
포트폴리오
데이터 분석, 어렵지 않아요!
캐글로 배우는 실전 데이터 분석.

파이썬 데이터 분석부터 캐글 입문까지
데이터 분석에 차근차근 입문해 보세요.

캐글(Kaggle)이란?
국내외적으로 공인된 프로그래밍 경진대회입니다.

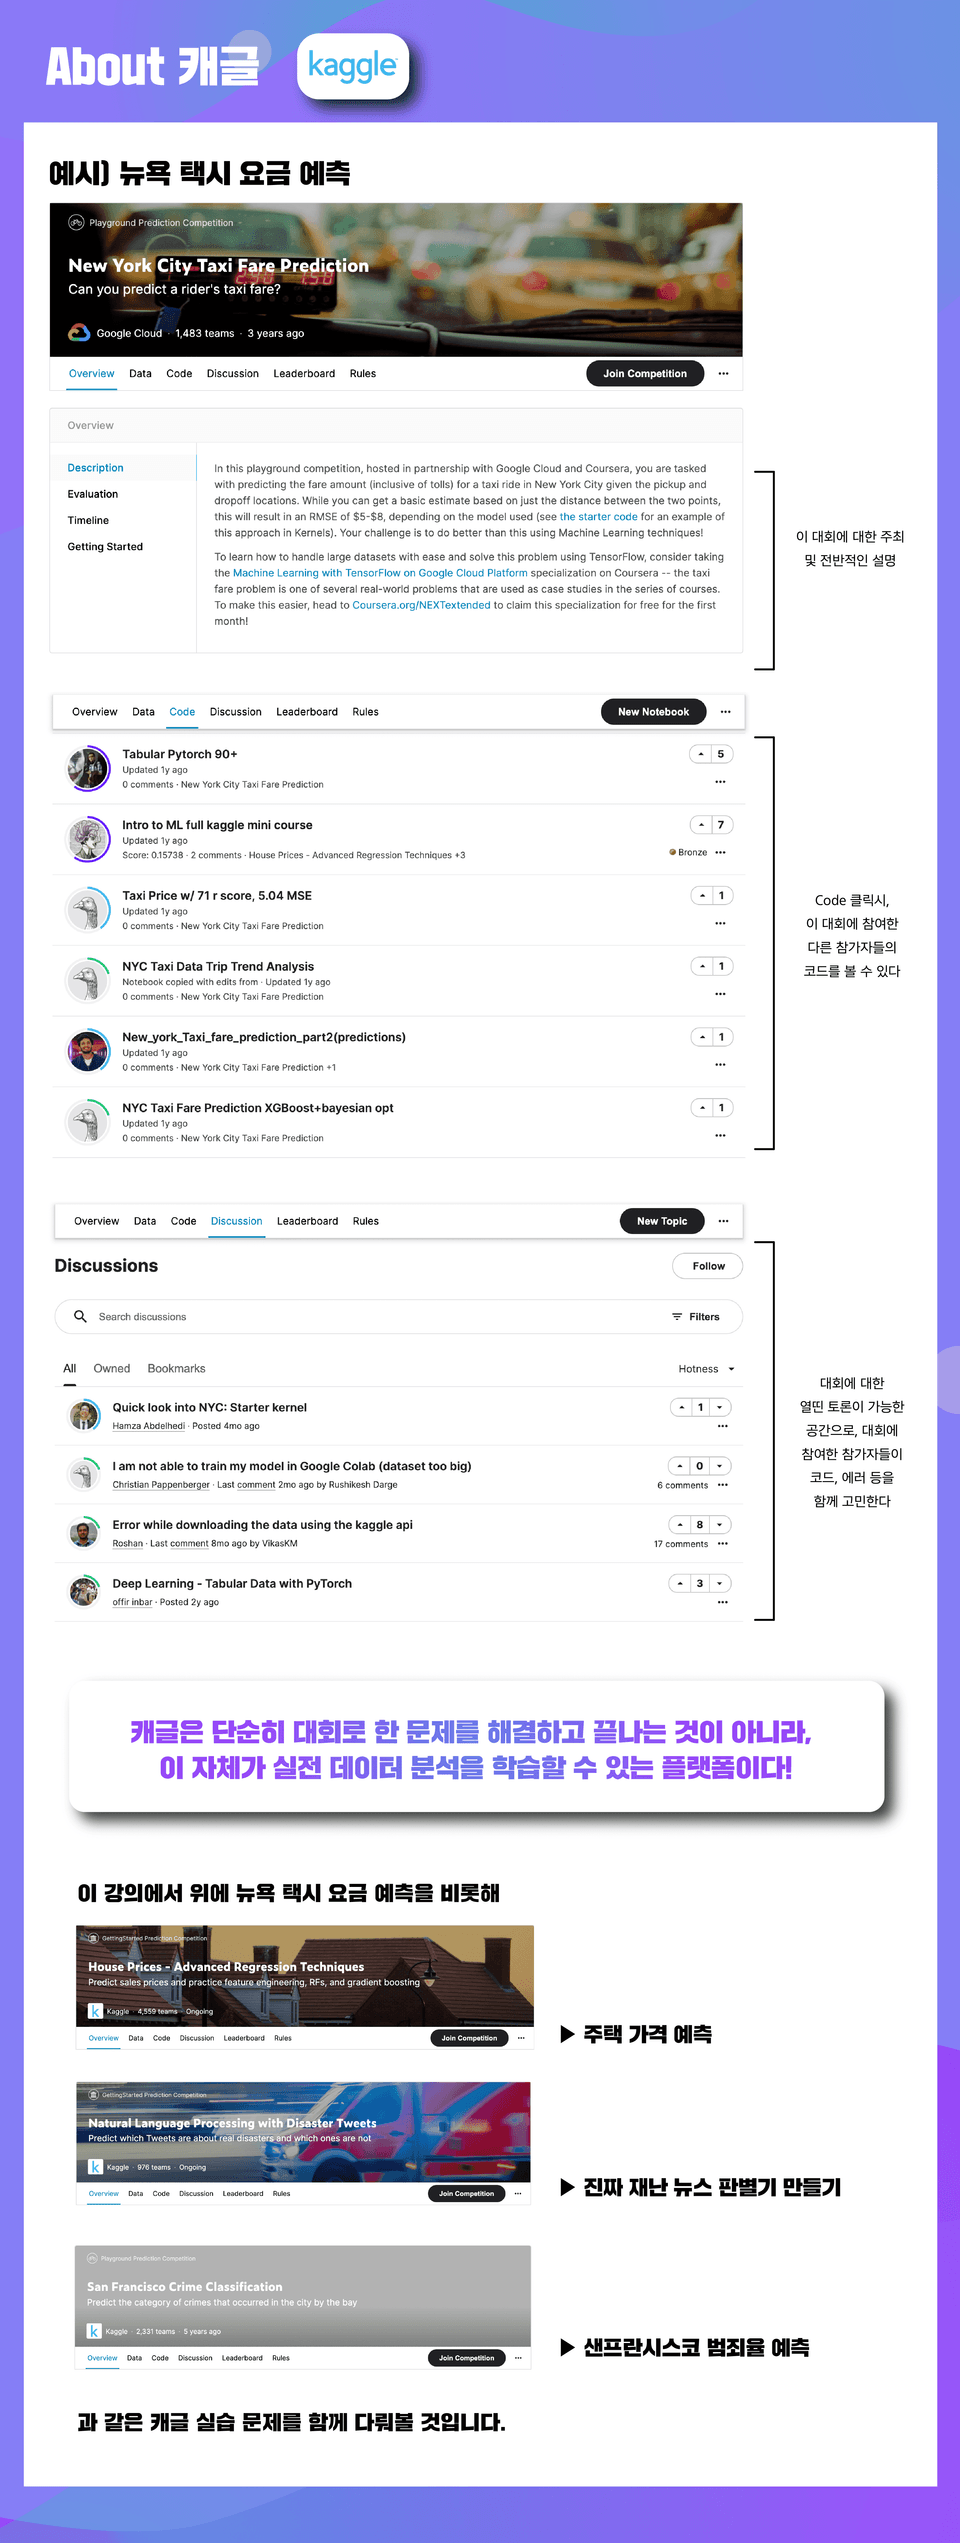
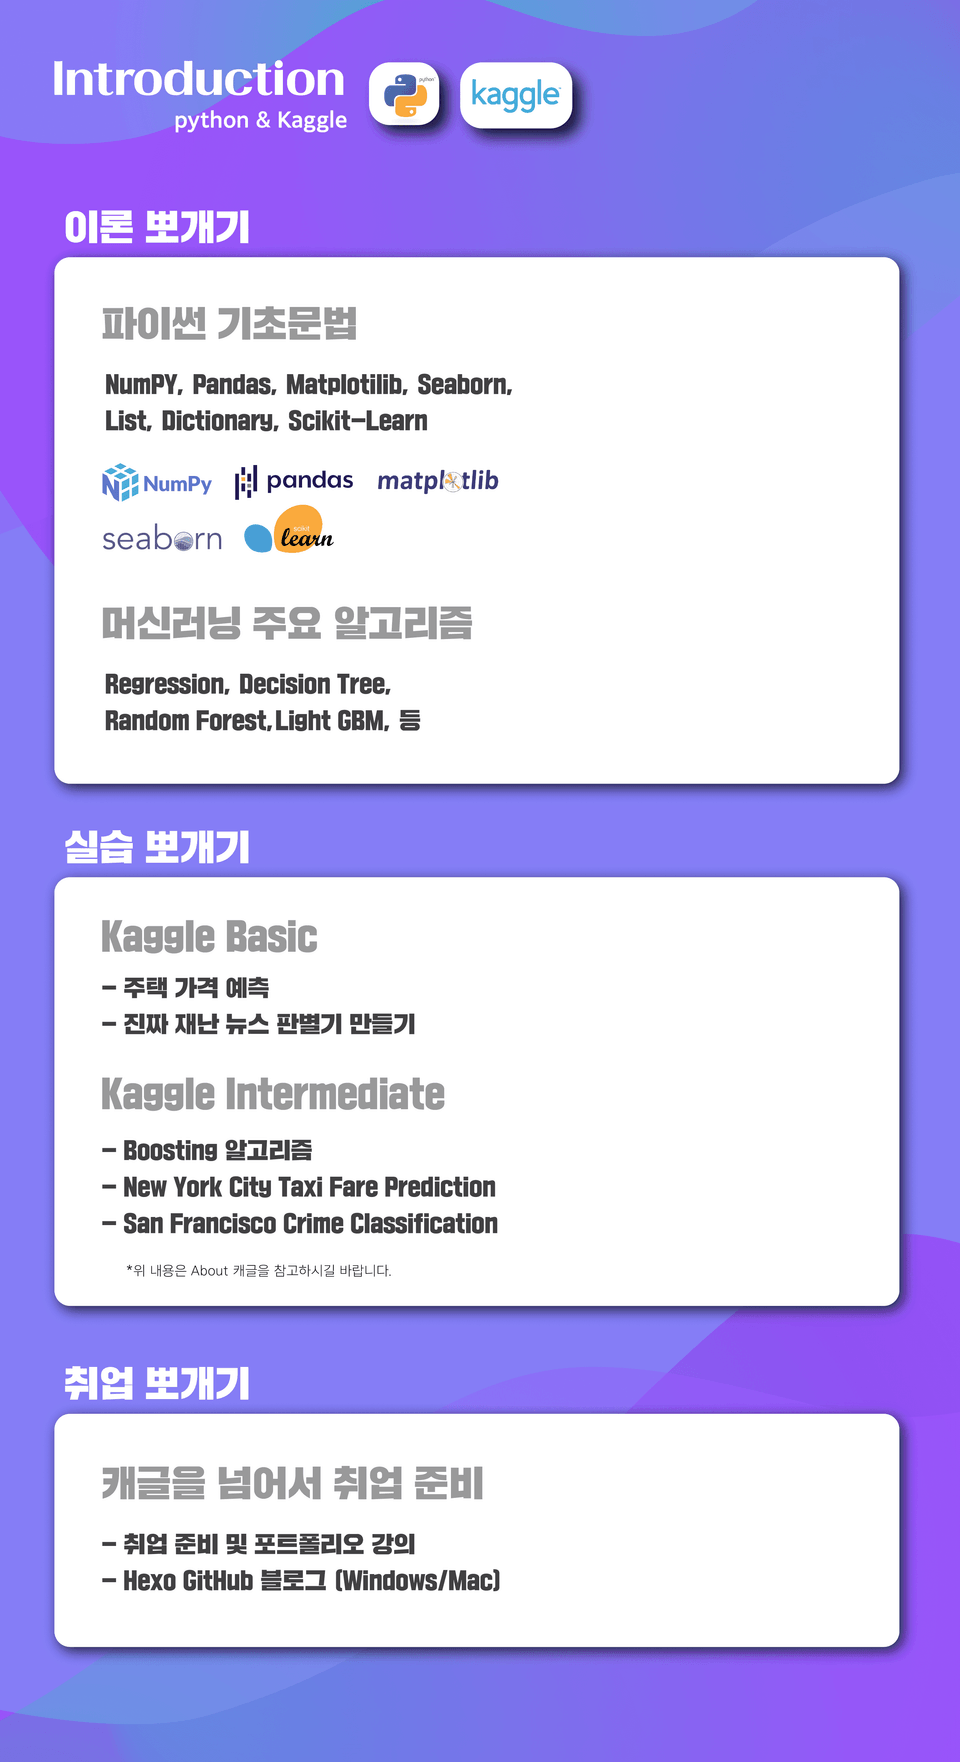
이론 20% + 실습 80%로 강의가 진행됩니다.
강사가 참조한 링크를 공유해, 부족한 이론을 보충하고 스스로 학습하는 데 도움을 줍니다.
*링크 참고시, 영어가 익숙하지 않은 분들은 구글 번역기 및 파파고와 함께 이용해주세요 :)
파이썬으로 시작해서 포트폴리오로 취업까지, 파이썬으로 캐글 뽀개기 (*저자 직강)
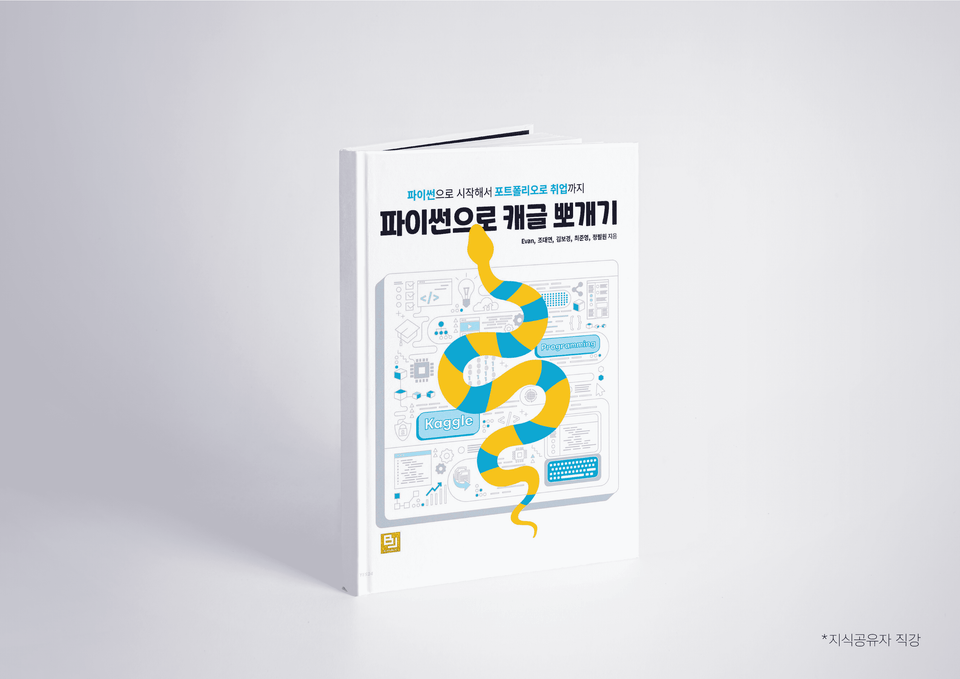
이 교재는 데이터 분석에 대한 간단한 이론과 원리를 배운 후 빠르게 캐글에 도전하는 지침서입니다.
캐글에 도전하며 겪게 될 좌충우돌한 다양한 스토리를 소개하고,
캐글에 도전하는 것만큼 중요한 취업 포트폴리오가 보관될 Github 사용법과 Github Blog를 만드는 방법도 포함하고 있습니다.
이 교재는 데이터 분석가를 희망하는 모든 분에게 가이드가 될 것입니다.
*교재 구입은 필수가 아닙니다.
구글 Gmail 계정만으로도 충분히 강의를 수강하실 수 있습니다.
단, 구글 드라이브 용량을 충분히 확보하셔서 데이터 업로드 공간을 여유롭게 두시기 바랍니다.

학습 대상은
누구일까요?
코딩을 처음 접하는 사람
캐글을 처음 접하는 사람
깃허브 블로그를 만들고 싶은 사람
132
명
수강생
14
개
수강평
18
개
답변
4.4
점
강의 평점
1
개
강의
안녕하세요,
현재 국민대학교 비즈니스IT전문대학원에서 박사과정을 진행하고 있으며, 취업준비생들의 취업을 진심으로 돕기 위한 강의와 재직자들을 대상으로 R, Python, SQL, Excel, Tableau 등 분석과 관련된 강의로 밥벌이를 하고 있는 Evan입니다. 이제 만 3년이 되었는데, 국방부, 육군본부, 하나금융에서 단기강의로 강의를 시작한 이래로 다양한 기관(한국IT비즈니스협회, 한국능률협회, 한국소프트웨어기술진흥협회, 삼육대 등)에서 강의를 진행하였습니다. 현재는 2023년부터 위 기관 외에도 멀티캠퍼스에서 강의를 하나 맡아서 장기적으로 취업 준비생을 대상으로 교육을 진행하고 있습니다.
전체
38개 ∙ (15시간 24분)
해당 강의에서 제공:
21. Chapter 5. 머신러닝 역사와 알고리즘 소개
01:23:26
22. Chapter 1-1. 주택 가격 예측 문제
01:08:39
23. Chapter 1-2. 주택 가격 예측 문제
01:05:27
전체
3개
4.7
3개의 수강평
지식공유자님의 다른 강의를 만나보세요!
같은 분야의 다른 강의를 만나보세요!


![[퇴근후딴짓] 빅데이터 분석기사 실기 (작업형1,2,3)강의 썸네일](https://cdn.inflearn.com/public/courses/329972/cover/dcfb28fd-48c1-4bb1-ab31-d59eac874194/329972-original.png?f=avif&w=420)
![[리뉴얼] 처음하는 파이썬 머신러닝 부트캠프 (쉽게! 실제 캐글 문제 풀며 정리하기) [데이터분석/과학 Part2]강의 썸네일](https://cdn.inflearn.com/public/courses/327464/cover/55c4db7b-7764-43cc-ac75-d9e8d08098f1/327464-eng.png?f=avif&w=420)


