


mmdetection mask-rcnn 추론결과 title 이름 변경 관련
649
작성자 없음
안녕하세요 강사님 mmdetection 관련해서 이론적으로나 실무적으로나 항상 많은 도움 받고있습니다.
강의 내용을 바탕으로 mmdetection code를 작성하던 도중 질문사항이 생겨서요 ㅎㅎ
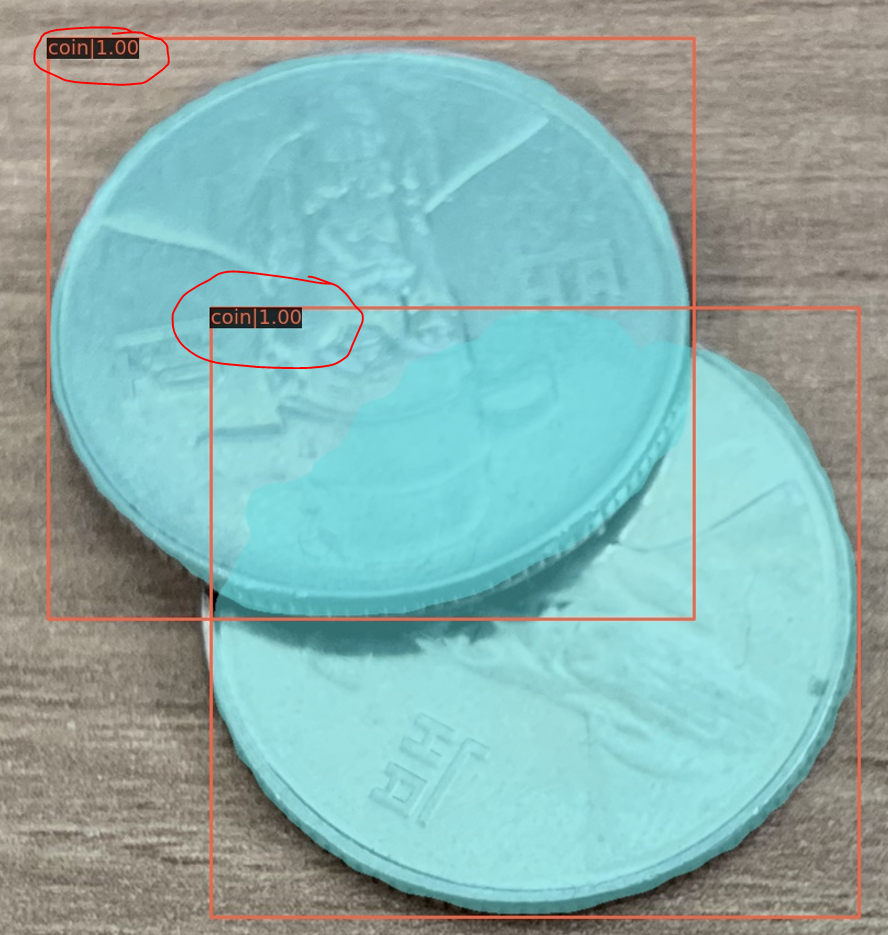
mmdetection Mask R-CNN 모델을 이용하여 추론결과 아래 사진과 같이
mask, bbox 두가지가 나타나는데 bbox위에 나타나는 title(coin) 대신 변수를 표시하고 싶습니다.
class name, confidence score 가 아닌 ID, pixel number를 표시하고 싶습니다.
제 코드는 다음과 같습니다.
img_name = path_dir + '/' + file_list[i]
        img_arr= cv2.imread(img_name, cv2.IMREAD_COLOR)
        img_arr_rgb = cv2.cvtColor(img_arr, cv2.COLOR_BGR2RGB)
        # cv2.imshow('img',img)
        fig= plt.figure(figsize=(12, 12))
        plt.imshow(img_arr_rgb)

        # inference_detector의 인자로 string(file경로), ndarray가 단일 또는 list형태로 입력 될 수 있음.
        results = inference_detector(model, img_arr)

        #추론결과 디렉토리에 저장
        model.show_result(img_arr, results, score_thr=0.8, title=  bbox_color=(0,0,255),thickness=0.5,font_size=7, out_file= f'{save_dir1}{file_list[i]}')
이 결과 추론되는 사진은 다음과 같습니다
아래는 mmdetection/mmdet/core/visualization/image.py에 있는 imshow_det_bboxes 함수입니다.
아래 함수가 시각화 해주는 함수여서 해당 함수를 수정하면 될 것 같은데
아무리 뜯어봐도 어디를 고쳐야할 지 도저히 감이 오질 않습니다 ...ㅠㅠ
def imshow_det_bboxes(img,
                      bboxes,
                      labels,
                      segms=None,
                      class_names=None,
                      score_thr=0,
                      bbox_color='green',
                      text_color='green',
                      mask_color=None,
                      thickness=2,
                      font_size=13,
                      win_name='',
                      show=True,
                      wait_time=0,
                      out_file=None):
    """Draw bboxes and class labels (with scores) on an image.

    Args:
        img (str or ndarray): The image to be displayed.
        bboxes (ndarray): Bounding boxes (with scores), shaped (n, 4) or
            (n, 5).
        labels (ndarray): Labels of bboxes.
        segms (ndarray or None): Masks, shaped (n,h,w) or None
        class_names (list[str]): Names of each classes.
        score_thr (float): Minimum score of bboxes to be shown.  Default: 0
        bbox_color (str or tuple(int) or :obj:`Color`):Color of bbox lines.
           The tuple of color should be in BGR order. Default: 'green'
        text_color (str or tuple(int) or :obj:`Color`):Color of texts.
           The tuple of color should be in BGR order. Default: 'green'
        mask_color (str or tuple(int) or :obj:`Color`, optional):
           Color of masks. The tuple of color should be in BGR order.
           Default: None
        thickness (int): Thickness of lines. Default: 2
        font_size (int): Font size of texts. Default: 13
        show (bool): Whether to show the image. Default: True
        win_name (str): The window name. Default: ''
        wait_time (float): Value of waitKey param. Default: 0.
        out_file (str, optional): The filename to write the image.
            Default: None

    Returns:
        ndarray: The image with bboxes drawn on it.
    """
    assert bboxes.ndim == 2, \
        f' bboxes ndim should be 2, but its ndim is {bboxes.ndim}.'
    assert labels.ndim == 1, \
        f' labels ndim should be 1, but its ndim is {labels.ndim}.'
    assert bboxes.shape[0] == labels.shape[0], \
        'bboxes.shape[0] and labels.shape[0] should have the same length.'
    assert bboxes.shape[1] == 4 or bboxes.shape[1] == 5, \
        f' bboxes.shape[1] should be 4 or 5, but its {bboxes.shape[1]}.'
    img = mmcv.imread(img).astype(np.uint8)

    if score_thr > 0:
        assert bboxes.shape[1] == 5
        scores = bboxes[:, -1]
        inds = scores > score_thr
        bboxes = bboxes[inds, :]
        labels = labels[inds]
        if segms is not None:
            segms = segms[inds, ...]

    mask_colors = []
    if labels.shape[0] > 0:
        if mask_color is None:
            # Get random state before set seed, and restore random state later.
            # Prevent loss of randomness.
            # See: https://github.com/open-mmlab/mmdetection/issues/5844
            state = np.random.get_state()
            # random color
            np.random.seed(42)
            mask_colors = [
                np.random.randint(0, 256, (1, 3), dtype=np.uint8)
                for _ in range(max(labels) + 1)
            ]
            np.random.set_state(state)
        else:
            # specify  color
            mask_colors = [
                np.array(mmcv.color_val(mask_color)[::-1], dtype=np.uint8)
            ] * (
                max(labels) + 1)

    bbox_color = color_val_matplotlib(bbox_color)
    text_color = color_val_matplotlib(text_color)

    img = mmcv.bgr2rgb(img)
    width, height = img.shape[1], img.shape[0]
    img = np.ascontiguousarray(img)

    fig = plt.figure(win_name, frameon=False)
    plt.title(win_name)
    canvas = fig.canvas
    dpi = fig.get_dpi()
    # add a small EPS to avoid precision lost due to matplotlib's truncation
    # (https://github.com/matplotlib/matplotlib/issues/15363)
    fig.set_size_inches((width + EPS) / dpi, (height + EPS) / dpi)

    # remove white edges by set subplot margin
    plt.subplots_adjust(left=0, right=1, bottom=0, top=1)
    ax = plt.gca()
    ax.axis('off')

    polygons = []
    color = []
    for i, (bbox, label) in enumerate(zip(bboxes, labels)):
        bbox_int = bbox.astype(np.int32)
        poly = [[bbox_int[0], bbox_int[1]], [bbox_int[0], bbox_int[3]],
                [bbox_int[2], bbox_int[3]], [bbox_int[2], bbox_int[1]]]
        np_poly = np.array(poly).reshape((4, 2))
        polygons.append(Polygon(np_poly))
        color.append(bbox_color)
        label_text = class_names[
            label] if class_names is not None else f'class {label}'
        if len(bbox) > 4:
            label_text += f'|{bbox[-1]:.02f}'
        ax.text(
            bbox_int[0],
            bbox_int[1],
            f'{label_text}',
            bbox={
                'facecolor': 'black',
                'alpha': 0.8,
                'pad': 0.7,
                'edgecolor': 'none'
            },
            color=text_color,
            fontsize=font_size,
            verticalalignment='top',
            horizontalalignment='left')
        if segms is not None:
            color_mask = mask_colors[labels[i]]
            mask = segms[i].astype(bool)
            img[mask] = img[mask] * 0.5 + color_mask * 0.5

    plt.imshow(img)

    p = PatchCollection(
        polygons, facecolor='none', edgecolors=color, linewidths=thickness)
    ax.add_collection(p)

    stream, _ = canvas.print_to_buffer()
    buffer = np.frombuffer(stream, dtype='uint8')
    img_rgba = buffer.reshape(height, width, 4)
    rgb, alpha = np.split(img_rgba, [3], axis=2)
    img = rgb.astype('uint8')
    img = mmcv.rgb2bgr(img)

    if show:
        # We do not use cv2 for display because in some cases, opencv will
        # conflict with Qt, it will output a warning: Current thread
        # is not the object's thread. You can refer to
        # https://github.com/opencv/opencv-python/issues/46 for details
        if wait_time == 0:
            plt.show()
        else:
            plt.show(block=False)
            plt.pause(wait_time)
    if out_file is not None:
        mmcv.imwrite(img, out_file)

    plt.close()

    return img
감사합니다
답변 1
0
안녕하십니까,
제 강의가 도움이 되고 있다니 저도 기쁘군요.
imshow_det_bboxes 를 사용하시려면 image.py에 있는 함수들을 뜯어 고쳐야 할 것 같습니다.
아래 draw_labels에 보시면 인자로, labels, positions, scores, class_names가 들어갑니다.
여기서 labels 값을 함수내에서 label_text로 class_names에 score 까지 합해서 만들고 이걸 ax.text( )를 호출해여 사각형 box 형태에서 positions 위치에 label_text값을 표시합니다.
원하시는 대로 하시려면 draw_labels에서 segmentation 값을 인자로 넣으셔서 가공하셔야 할 거 같습니다. segmentation 정보를 입력받아서 표시하는 것은 draw_masks() 함수를 활용해 보십시요. 재 생각에 draw_masks() 함수와 draw_labels()인자와 로직을 잘 결합하시면 방법을 찾으실 수 있을 것 같습니다.
감사합니다.
MMDetection 버전 이슈
0
94
2
강의 환경설정 질문
0
100
2
Custom Dataset에서의 polygon 정보 관련
0
143
3
cvat.ai 보안 수준이 궁금합니다
0
131
2
캐클 nucleus 챌린지 runpod 실습 코드 에러 질문드립니다.
0
162
3
추론 결과의 Precision(또는 mAP) 평가 방법
0
134
2
mmdetection mask rcnn inferenct 실습 시 runpod 템플릿 관해서 질문드립니다.
0
97
2
runpod에서 google drive 연결 시 오류 발생
0
162
2
로드맵 선택
0
95
1
mmcv
0
91
2
Anchor box의 Positive 처리 위치
0
95
2
해당 강의 runpod 적용 후 에러 제보드립니다
0
134
2
run pod credit 관련 제보
0
176
2
mmdetection 2.x과 3.x 호환 관련 표기
0
118
2
mm_faster_rcnn_train_kitti.ipynb 실행 오류
0
152
3
질문 드립니다.
0
116
3
mm_faster_rcnn_train_coco_bccd 실행 오류 질문드립니다.
0
114
1
강사님께 수정을 제안드리고 싶은 것이 있습니다.
0
123
1
google automl efficientdet 다운로드 및 설치 오류
0
109
1
이상 탐지에 사용할 비전 기술 조언 부탁드립니다.
0
143
2
OpenCV 관련 질문드립니다.
0
115
2
mmcv 설치관련해서 문의드려요
0
410
3
강의 구성 관련해서 질문이 있습니다
1
165
2
모델 변환 성능 질문드립니다.
0
142
1