Welcome to Tableau World
VizLab
Free
Basic / Tableau
4.9
(162)
6,800+
Learn the basics of Tableau, the most popular data visualization tool today.
Basic
Tableau
All topics related to the set functions available in Tableau are organized in one place.

Reviews from Early Learners
5.0
김용철
The explanations and examples are concise and clear, which is great.
5.0
SEOTAEJOO
It's helping me a lot in studying Tableau. Thank you.
5.0
정민하
I'm just starting out with Tableau, but I think I'll be able to use it a lot here and there because you explained the concept of sets so easily. Thank you.
The concept of a set in Tableau
Different ways to create sets
Comparison of sets and other similar functions
How to use set actions and set controls
Resolving Order of Operations issues related to sets
VizLab's monthly Tableau is an online seminar that started with the purpose of thinking about better ways to utilize the software called 'Tableau' together with people who are using Tableau in the field.
We'll continue to refine this platform to create a space for everyone to discuss new ideas, better screen layouts, and more efficient calculations, all while working on their own tasks. We hope to grow together by discussing Tableau's real-world use cases with industry experts with extensive domain knowledge. We're open to all kinds of ideas, topics, and datasets. We encourage your active participation ( bryan@vizlab.kr ).

The theme of our sixth monthly Tableau in June 2020 is "sets." We believe the purpose of using Tableau in our work is to accurately understand the current situation and derive actionable insights based on that understanding. Comparative context is essential to determine the current state of our business, whether we are doing well, or whether we need to improve further. Comparisons with various targets—for example, past performance, competitor performance, and our own goals—provide a three-dimensional understanding of our current situation.
This is where Tableau's aggregation feature shines most powerfully. The essence of aggregation is "separation," which allows you to distinguish between groups of interest and those of no interest. What makes aggregation even more effective is that these separations can be used anywhere in Tableau, just like regular dimension fields. Once you've created a separation, you can consistently and repeatedly apply it across the screen. Let's take a detailed look at these characteristics of aggregation, from A to Z, in the following subtopics.
☑️ The essence of a set is separation, and there are several ways to achieve that separation. You can directly select the members you want, set a certain criterion and only take members that meet that criterion, or line up the members based on a certain criterion and then select a few from the top (or bottom). You can even combine these methods. We'll practice various methods of creating sets by setting up specific business situations.
☑️ Beyond the basics of creating sets, we'll explore how to perform operations between them. Furthermore, Tableau offers other functions similar to sets, called "groups" and "clustering." We'll compare these functions to see how sets differ from these other functions.
☑️ While creating a set, you set the IN member of the set. Later, during analysis, you may need to change the IN member. We'll examine two ways to address this: the set actions feature introduced in version 2018.3 and the set controls feature introduced in version 2020.2. Finally, we'll examine the Order of Ops issue that can arise when using sets with filters, and we'll use context filters to address it.
Since this seminar focuses on Tableau's collective "function," there aren't many images that can be specifically called "target screens." Let's create a screen like the one below and examine how collectives work to create such images!
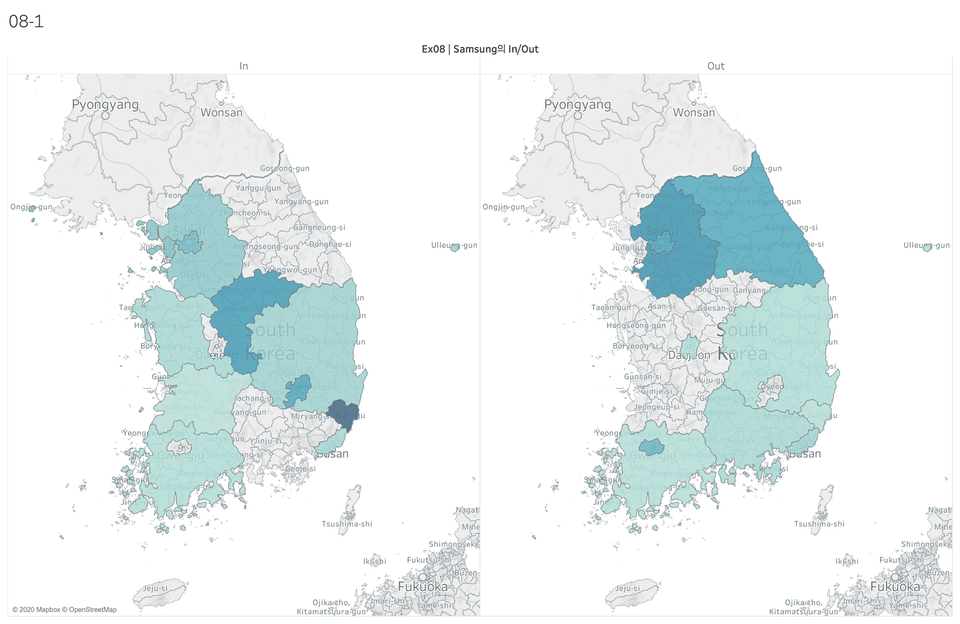
The image above compares the sales of Samsung Electronics and Apple phones regionally (of course, this is a hypothetical situation based on sample data). Let's create this screen using the combined set function to identify Samsung phones and compare them to Apple phones.
The image above shows a screen where a set action has been set up, allowing two sheets to be linked and highlighted by simply hovering the mouse over a specific area. Furthermore, the set controller on the right can be used to easily change the IN members of the set. Set actions provide a convenient UI/UX environment for users to explore data. Let's take a closer look at how to implement this feature in the class!
![]()
Tableau Desktop Professional is a paid product, but offers a two-week free trial. You can download Tableau Desktop Professional here .
The Tableau Desktop Public version is available for free and can be downloaded here .
The biggest difference between the desktop Pro version and the public version is
(1) The public version cannot save the created workbook to the local machine.
(2) The public version cannot retrieve data stored in the database.
The public version is also suitable for following this course. Guidelines for installing Tableau can be downloaded here . However, the Tableau workbook provided in the course cannot be opened in the public version of Tableau. Therefore, public users must install Tableau Reader (download here ) to open the provided workbook.
This seminar is a recording of an online seminar held LIVE on June 8, 2020.
It's been properly edited and organized into a format that's easy to learn. Please refer to it when making your purchase decision!
Q. Who would benefit from this seminar?
A. I always think that using Tableau to create a comparative context is a valuable tool. It allows you to see the current situation in a three-dimensional way. I believe this aspect aligns with the fundamental reason for using Tableau in the workplace. In that sense, the aggregation function is a truly excellent feature, closely related to the essence of Tableau's use. Aggregation begins with separating what we care about from what we don't. For those who seek to find messages through comparisons between two groups, I highly recommend this seminar to familiarize yourself with the aggregation function.
Q. What functional aspects of Tableau will this seminar cover?
A. This book covers everything about sets. It covers everything from how to create sets, comparing them with similar functions like groups or clusters, set actions, and issues related to sets and Order of Operations. The level of difficulty is a mix of basic and intermediate content, so anyone with some experience using Tableau should find it relatively easy.
Q. Is there anything I need to prepare before attending this seminar?
A. Since this seminar covers the intermediate level of Tableau's functions, we recommend that you first complete pre-learning courses such as Welcome to Tableau and Tableau Level Up before attending. This will help you understand Tableau much better.
Q. Where can I download study materials?
A. The study materials for this seminar can be downloaded from Section 1, Lesson 1, "The Concept of Sets," after purchasing the course. The materials consist of (1) the Superstore KR - VizLab 2020 Excel data file, (2) the seminar guide document, and (3) a Tableau workbook for practice (Versions 2020.2 & 2020.1).
Who is this course right for?
Those who use Tableau to analyze the characteristics of two different groups
For those who want to learn everything about Tableau's collection functions from basic to advanced
Need to know before starting?
Welcome to Tableau World
Tableau Level Up
10,965
Learners
326
Reviews
126
Answers
4.9
Rating
8
Courses
I am a Tableau Dashboard Developer and Tableau Certified Instructor running VizLab. I build BI dashboards and provide related consulting services for companies in Korea and Europe. I also create and share Tableau-related content on my YouTube channel in my spare time. I look forward to this being a great opportunity for all of us to grow together as we study and share ideas :D
* VizLab Email: bryan@vizlab.kr
* VizLab Profile: https://www.linkedin.com/in/bryan-j-choi/
* VizLab Website: https://vizlab.tistory.com/
* VizLab YouTube Channel: http://bit.ly/BryanVizLab
* VizLab Portfolio: http://bit.ly/BryanWorks
All
7 lectures ∙ (1hr 10min)
Course Materials:
All
10 reviews
4.9
10 reviews
Reviews 1
∙
Average Rating 5.0
5
I'm just starting out with Tableau, but I think I'll be able to use it a lot here and there because you explained the concept of sets so easily. Thank you.
Sets seem to be a feature that users don't use as much as they think, but if you learn them, they can be very useful. Try applying them in practice!
Reviews 10
∙
Average Rating 5.0
Reviews 1
∙
Average Rating 5.0
5
Please explain it in an easy-to-understand way!
Thank you! Please use it well in your work ^^
Reviews 4
∙
Average Rating 5.0
Check out other courses by the instructor!
Explore other courses in the same field!
25% off for new members
$13.20
25%
$13.20


![[D-PEC UP_PASS] National Technical Qualification: Management Information Visualization Ability (Written Exam)Course Thumbnail](https://cdn.inflearn.com/public/files/courses/336327/cover/01jytyqa2egrzn52a7m57fntzk?w=420)