Perfect introduction to Tableau.
Easy to repeat and learn in 5 minutes or so per lecture.
Concise and clear information delivery.
The honey tips here and there are really great for practitioners.
5.0
김준영
6% enrolled
It was nice to be able to learn about Tableau from the basics.
5.0
최나현
100% enrolled
Personally, I was studying Tableau on my own, but I had limitations, so I looked for a lecture that would teach me the basics and chose it. It was so easy to understand and I think I memorized it better when I actually tried it. Thank you~!!
What you will gain after the course
Full scope of the Tableau Desktop Foundations (formerly Tableau Desktop Specialist) certification
Data connection via Tableau
Data Visualization with Tableau
How to share insights through Tableau
Master Tableau data analysis and visualization, from basics to hands-on practice, all in one course!
Tableau, isn't there a way to handle it easily with just a few clicks?
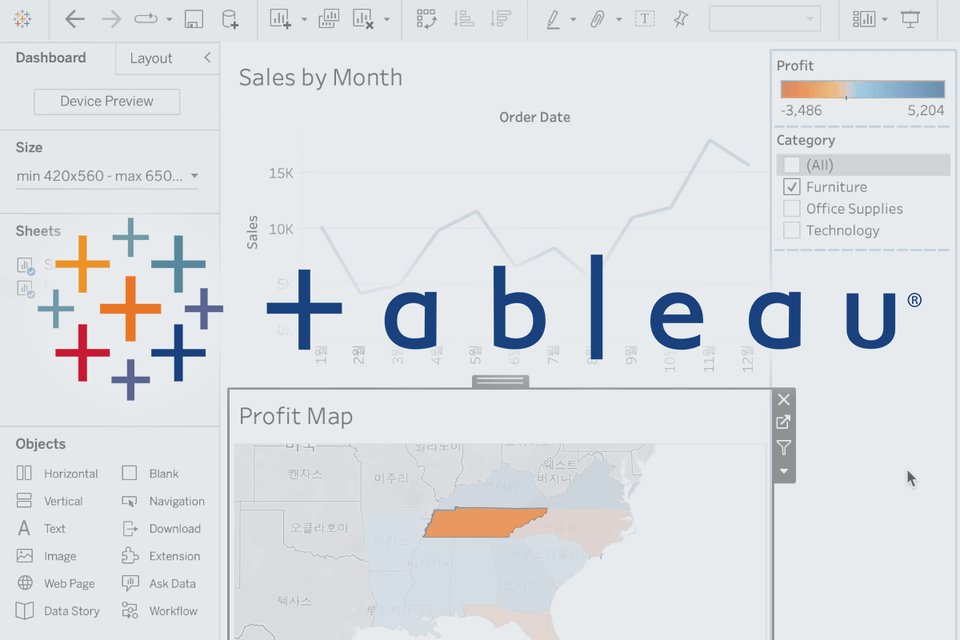
A powerful data analysis/visualization tool, Tableau
Tableau is a convenient tool that allows you to analyze data and create dashboards simply with a few clicks. Therefore, it is the perfect tool for those who cannot code but want to perform data analysis.
But did you open Tableau only to find so many things on the screen that you don't know where to start? Does the pressure of learning it for the first time feel overwhelming? For now, let's start with the goal of skimming through the scope of the certification exam!
Reduce the burden and increase the efficiency.
🙋♀️ Beginners who want to lightly skim through Tableau all at once
🙋♀️ Those who want to perform data analysis with just a few clicks
🙋♀️ Those who want to know which shortcuts are useful in Tableau
To enable data visualization and analysis that meets our needs, this course follows the official exam scope presented in the Tableau Desktop Foundations (formerly Tableau Desktop Specialist) Certification Guide.
Whenever you learn something new, it's natural to feel overwhelmed about where to start. In times like these, I use exams. That way, I can naturally learn the overall concepts while studying important details more deeply and skipping less important parts for now, allowing for efficient learning.
It's perfectly fine even if you don't obtain the certification. I designed this course from a beginner's perspective to reduce the initial burden of learning and help you approach Tableau with a light heart, step by step. This year, make sure to take your first step toward Tableau!
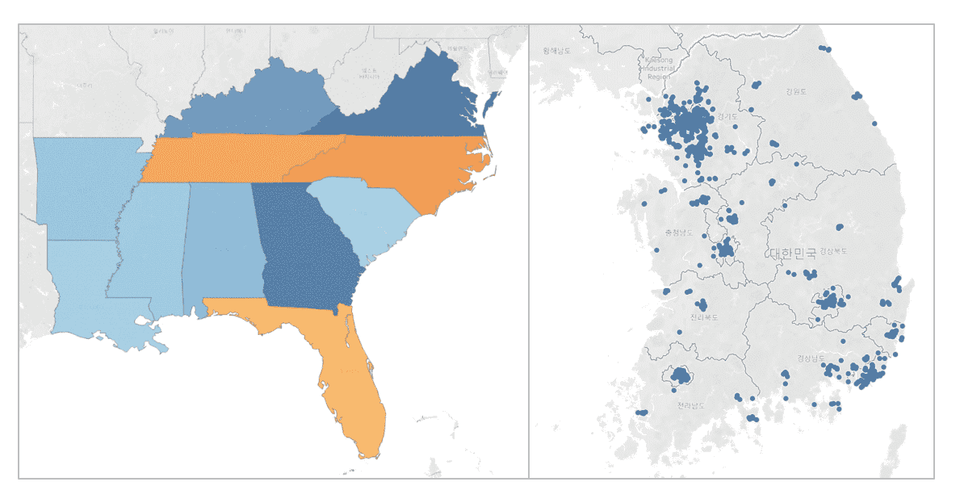
Map-based distribution visualization chart created with Tableau
Perfect for beginners! First Steps in Tableau
Efficient learning scope suggested by the official guide
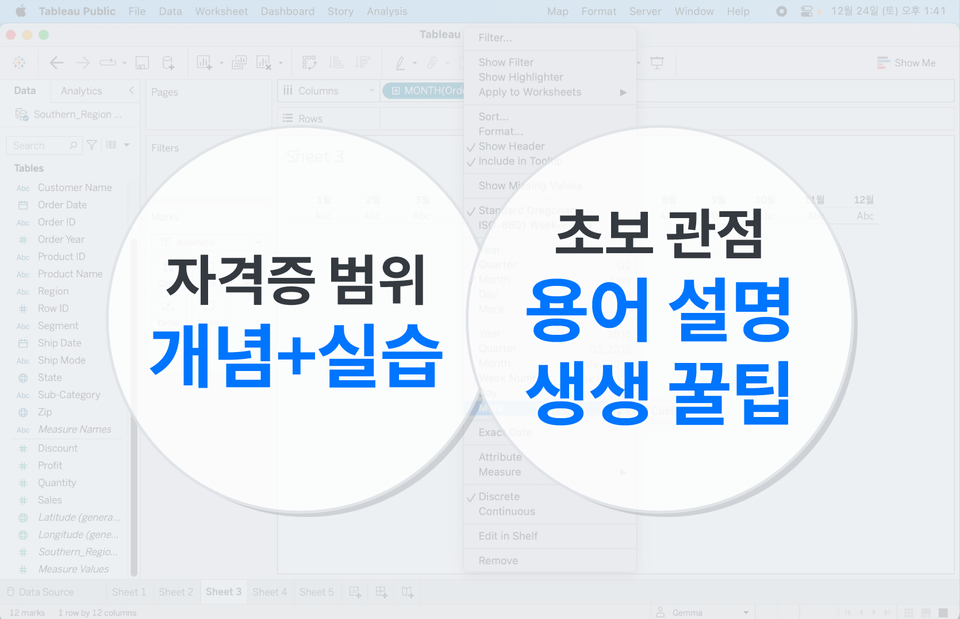
Since it follows the official exam scope, you can practice selection and focus. Starting from the basics, you will understand what Tableau's components mean, and you can learn quickly and effectively through the tips provided along the way.
Of course, studying and comparing these details on your own might feel overwhelming due to the English terminology and unfamiliar concepts. However, since this class combines conceptual explanations with hands-on practice, you will be able to follow along on your own while watching the lessons. Furthermore, the course is designed to reduce your burden by re-explaining English terms in Korean.
Lecture materials designed for beginners + Homework provided
Theory class PPTs are also provided for students. The first slide lists key Tableau terminology, allowing you to see at a glance what will be covered and which concepts and functions are important.
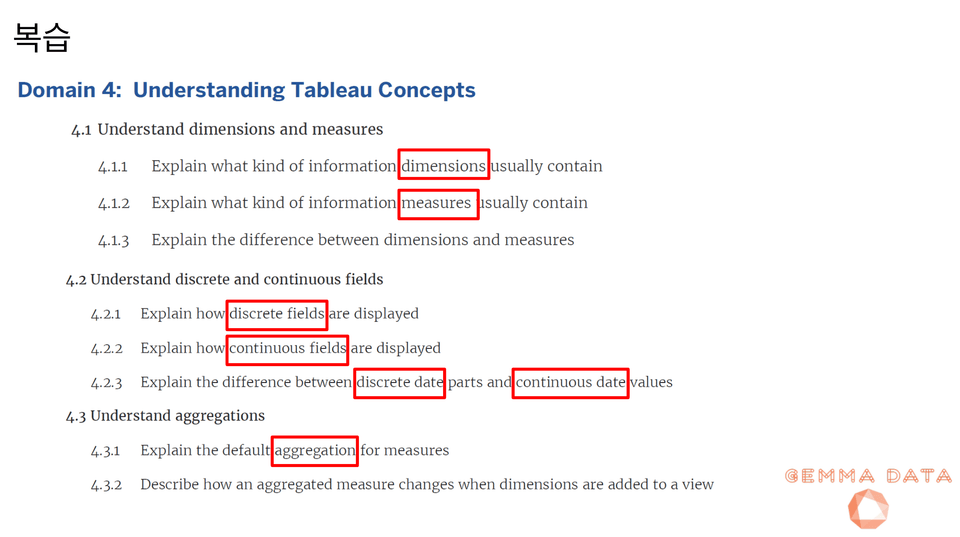
Along with a table of contents extracted from the Tableau certification guide, the final slide includes a section to review and connect the topics covered in the lecture. Furthermore, homework and solutions for each section are provided so that you can practice Tableau while studying on your own. Test your Tableau skills for yourself!
Detailed Curriculum
The lecture is largely divided into 4 parts.
Part 1. Understanding Basic Tableau Concepts
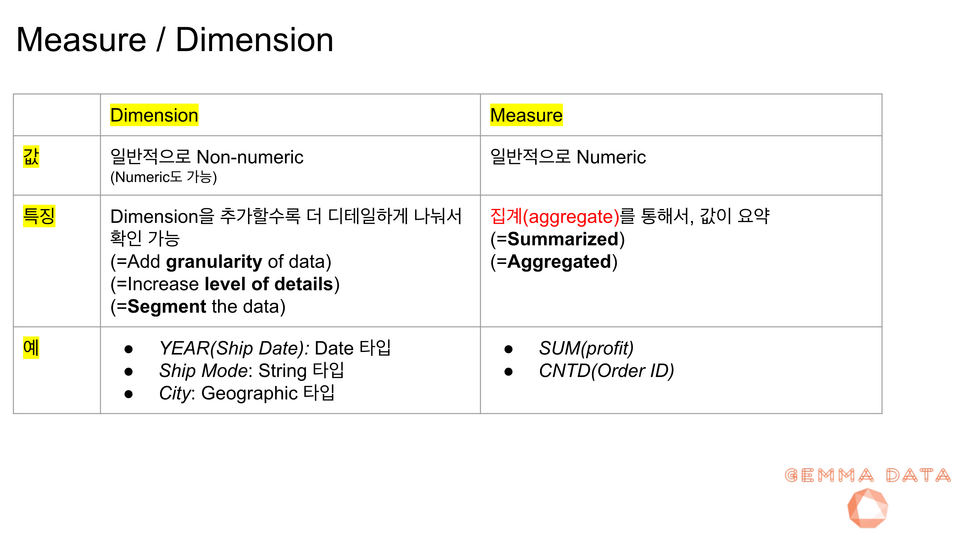
We cover the basic concepts of Tableau. We will prepare for the next part by defining terms such as Dimension vs Measure and Discrete vs Continuous.
Part 2. Data Analysis
You will learn step-by-step about basic Tableau charts (e.g., Bar chart, Line chart, Scatterplot, Map, etc.) and the Tableau features applied to them.
This part is the most important because it covers various visualization methods and detailed analysis. By completing Parts 1 and 2, you will gain the skills to independently analyze data of a size similar to Excel.
Part 3. Sharing Insights
It covers Tableau's unique way of effectively sharing insights discovered through data with others.
The ultimate goal of analyzing data is, in the end, to share the insights you have found with others. You will learn how to share the insights discovered through the content covered up to Part 2 using Tableau's Dashboard and Story features.
Part 4. Data Connection
You will learn about the methods required when combining two or more data files. Since most cases involve handling a single data file, this may not be necessary for all students, but let's learn about these new features that can be very useful to know.. Vì hầu hết mọi người đều xử lý một tệp dữ liệu duy nhất nên nội dung này không nhất thiết phải dành cho tất cả học viên, nhưng hãy cùng tìm hiểu về tính năng mới này để có thể sử dụng hữu ích khi cần mà không gặp áp lực nào.
태블로 개념 용어 정리 (Measure / Dimension)
중요 개념 복습
Q&A 💭
Q. What are the benefits of learning Tableau?
It is difficult to grasp the meaning of data with the naked eye once it exceeds just five entries. If you are dealing with thousands or tens of thousands of data points, it is nearly impossible to understand their form without the help of a tool. However, by learning Tableau, you can understand the characteristics of big data at a glance with just a few clicks. You can even experience the fun of discovering new insights that pop up every time you apply different methods.
Q. Is this a course that non-majors can also take?
Yes, this course is for beginners. You can approach Tableau just like the feeling of learning Excel for the first time through clicking!
Q. After completing this course, what level of proficiency will I be able to reach?
If you follow the first 50% of the course well, you will reach a level where you can analyze the data you want on your own using Tableau. Once you complete the remaining 50%, you will reach a level where you can share your insights with others.
Recommended for these people
Who is this course right for?
People who cannot code but want to do data analysis
People who want to skim through Tableau certifications
I am Gemma, a data analyst who started in mathematics, moved into a developer career, and eventually settled into my current role after studying statistics. In data analysis, the most important thing is identifying novel insights and trends within the overflowing sea of big data. That’s easier said than done, right? However, if you can utilize the right analysis tools and methods, anyone is capable of discovering valuable gems. I would like to share these methodologies with all of you.
Personally, I was studying Tableau on my own, but I had limitations, so I looked for a lecture that would teach me the basics and chose it. It was so easy to understand and I think I memorized it better when I actually tried it. Thank you~!!
It's the best for beginners. Each lecture is about 5 or 6 minutes long, so I think it's best because you can listen to it without getting bored. If the lectures are too long, you actually don't want to listen and lose focus, but since each lecture is short, you can finish it quickly without losing focus, which is really good. And I really like how you summarized the key points at the end.
Perfect introduction to Tableau.
Easy to repeat and learn in 5 minutes or so per lecture.
Concise and clear information delivery.
The honey tips here and there are really great for practitioners.


![[D-PEC UP_PASS] National Technical Qualification: Management Information Visualization Ability (Written Exam)Course Thumbnail](https://cdn.inflearn.com/public/files/courses/336327/cover/01jytyqa2egrzn52a7m57fntzk?w=420)