Learning Grafana through Practice - {{ x86-64, arm64 }}
To understand Grafana(💥) most easily and quickly, it has been structured with a focus on hands-on practice. 🧭 In particular, content verified in the already proven bestseller 'Kubernetes/Docker for Container Infrastructure Environment Construction' has been further expanded to allow deeper learning of Grafana itself. 💯 In addition, practical content is periodically added to 'supplementary lessons'. I am confident that there is no other lecture that covers Grafana this deeply and broadly!
How to configure monitoring visualization for effective Kubernetes operations
Building my own environment to freely practice Grafana
A thorough understanding of Panel, a key element of Grafana.
Accordion menu for more effective Grafana dashboard configuration
Export and import my dashboard
Get industry-certified, verified dashboards
Specificity of Grafana provided by Prometheus-stack
How to configure Grafana alerts
Grafana, from basics to practice all in one place!
The easiest and most comprehensive Grafana guide.
⚓ Kubernetes Dashboard with Grafana We can make it easier and more effective.
📢 Hands-on update to Kubernetes v1.30!
On June 16, 2024, the Kubernetes labs were updated to match v1.30.
Accordingly, ch2 has been changed to a form commonly used in all lectures, and the Grafana distribution that was previously in ch2 has been changed to 2.11.
Also changed the base operating system from CentOS 7 to Ubuntu 22.04.
There is no additional footage filmed for the v1.30 update.
The existing reinforcement is saved in A, and after v1.30, it will proceed to B.
🎉 Now officially supporting Mac silicon (M1, M2, M3, M4 / arm64) 😄
This lecture is designed to help you learn Grafana more easily by organizing the parts that are difficult to learn when learning Grafana through documentation and practicing all the content.
💡 Things to know before registering for a class
Grafana is not used alone, but is organically linked to the infrastructure system, so prior knowledge of Kubernetes and Prometheus, which are the current infrastructure systems, is absolutely necessary . If you do not have this prior knowledge, it will be difficult to proceed with the lecture, so please make sure to check the relevant content.
If you feel that the above content is sufficient and that the current lecture list will be helpful, I recommend that you proceed with the lecture.
A diagram categorized by usability to help you easily understand the core elements of Grafana, the Panel.
This lecture is structured so that you can learn about each panel through examples so that you can fully understand the panels, which are the core components of Grafana. In addition, we will look at various functions that can effectively create a green Grafana dashboard in the field through various panels. In order for students to effectively achieve these goals, the course will proceed according to the following structure.
Part 1. Configuring Grafana
ch1: Why Grafana?
ch2: 『Common』 Building a Kubernetes practice environment (+ Grafana deployment)
Part 2. Getting to know the Grafana dashboard and commonly used panels
ch3: Check Grafana menu configuration
ch4: [Stable] Frequently used panels in Grafana
ch5: Various options available in the Grafana panel
Part 3. Getting to know Grafana and other panels (optional)
ch6: [Stable] Panels used for specific purposes
ch7: [Stable] Infrequently used panels
ch8: [Beta] Experimental Panel
Part 4. Using Grafana
ch9: How to use Grafana Dashboard
Please refer to [Curriculum] below for detailed table of contents 😊
Why should I learn Grafana ?
Prometheus is designed to provide monitoring data for almost everything running on the infrastructure called Kubernetes. However, Prometheus is limited in its ability to create dashboards that people actually frequently view, check, and take action on. There are several tools that can supplement this, but the most widely used and data-rich tool is Grafana.
Therefore, if you implement a Kubernetes monitoring dashboard through Grafana , which is already used almost together with Prometheus, you will be able to operate and manage Kubernetes effectively.
In addition to Grafana provided by Grafana Labs, if you mix and match with Loki, Tempo, Mimir, and OnCall, you can also build and apply a very consistent management environment to build and operate a stable system.
So if you are already using or planning to use infrastructure such as Kubernetes, I hope you can learn Grafana as well as Prometheus as soon as possible and grow into a leading developer/engineer. So why not start learning about Grafana, which felt unfamiliar, right now? 😃
Kubernetes Monitoring Dashboard Green with Grafana (Related Content)
Features of this course
📕
This is the only Grafana specialized lecture in Korea that focuses on Grafana in depth and breadth.
🔎
We will explain Grafana's menu slowly and thoroughly to help learners understand.
🧰
We will introduce in detail how to use Grafana in practical applications .
👨💻
A lively lecture from a practitioner's perspective by a working Kubernetes engineer and IT open source contributor.
🚩
Expand your knowledge of k8s by going beyond the best-selling course, “Handling Kubernetes for Building a Container Infrastructure Environment.”
💾
For students who have difficulty setting up the Kubernetes lab environment, we provide an OVA (Open Virtualization Format)image file .
📖 We provide OVA (Open Virtualization Archive) and Qcow2 (QEMU copy on write) image files.
I have seen many people who have introduced Kubernetes around them and have difficulty expressing it after choosing Prometheus for monitoring. Even if you have understood Prometheus through the last lecture, 『Learning Prometheus through Practice』... you need a tool like Grafana that can express it in a way that people can easily understand .
Therefore, this lecture is designed to address the following concerns: 'How can we teach people how to use Grafana really easily?' and 'How can we make it work together in the Kubernetes ecosystem?'
If you listen to all of this lecture and understand the content, you will be able to freely use it in various panels described on the official Grafana website.
As a CNCF Ambassador, I regularly translate blogs and news into Korean.
What You Need to Know Now About Distributed Tracing for Kubernetes Apps (See translation)
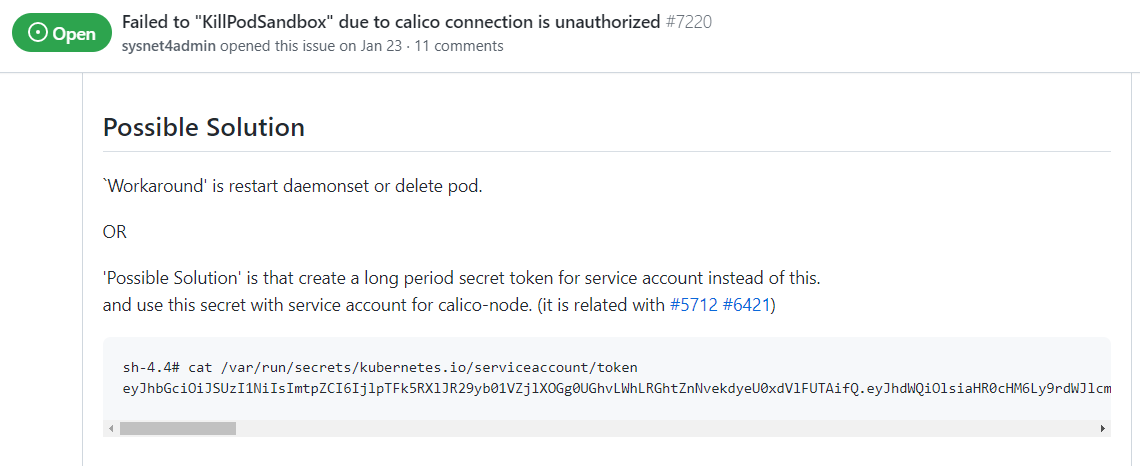
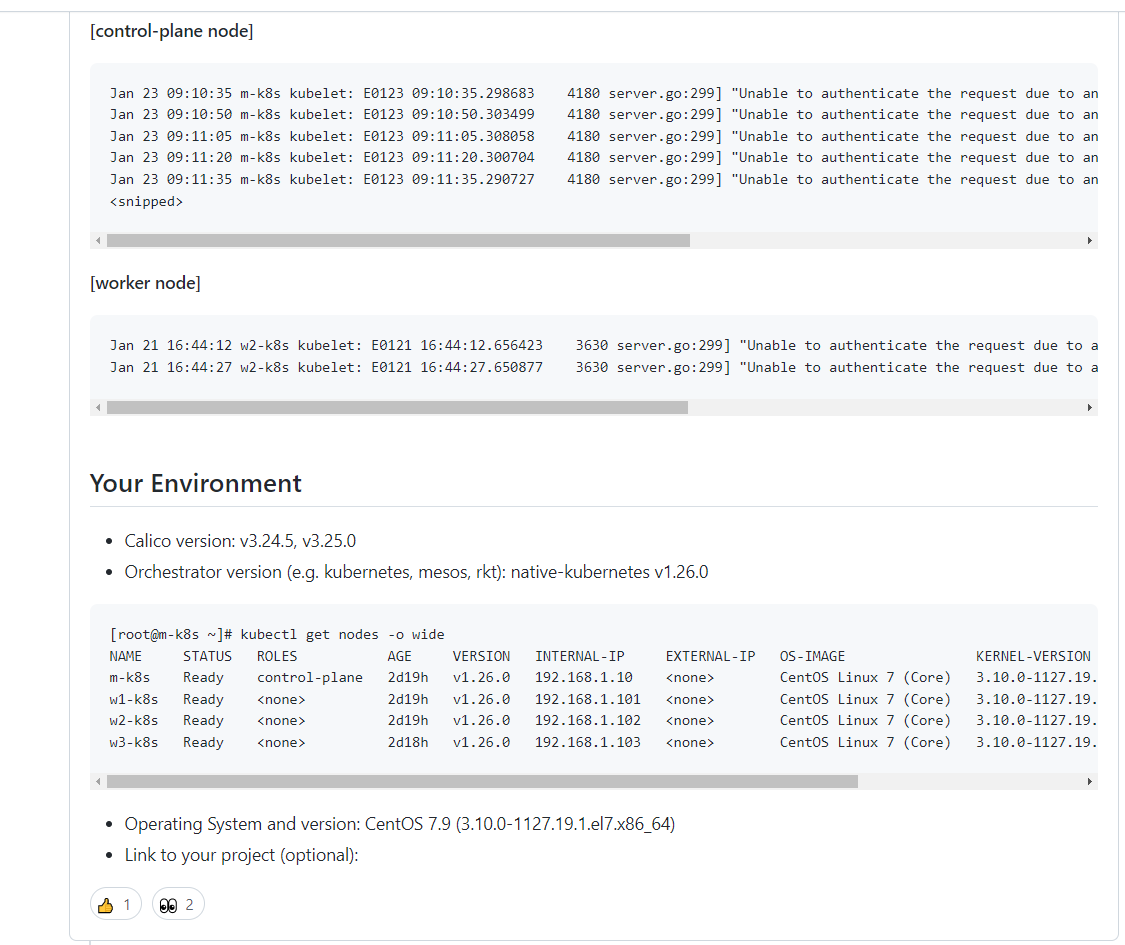
Raising issues related to Calico certification
• • • • • •
Create an issue that occurs in Calico v3.24.5, v3.20.0 and provide a workaround (see issue)
Q&A 💬
Q. Can I take this course without taking the pre-course 『Learning Prometheus through Practice』?
I want more people to learn the wonders of Grafana, but... Grafana is in an area that cannot be understood without knowing Prometheus, so I highly, highly recommend that you listen to the pre-lecture, 『Learn Prometheus through Practice』, and take the course. If you understand all the contents of the lecture, then you can of course skip it, but since it is a continuous lecture, I will just mention the contents explained in the lecture and move on.
Q. Do I have to learn Grafana through this course?
To be honest, 'no'. The best textbook is the official Grafana documentation . However, the official documentation is difficult to define from the beginning, where to start and how to learn. For example, you can think of the official Grafana documentation as a textbook, and this lecture as a reference book. However, in my personal opinion, the official Grafana documentation is not a textbook that is not organized as kindly as Prometheus, so I think you can learn Grafana more effectively by looking at the reference book first.
Q. Can I learn everything about Grafana just by taking this course?
As mentioned in previous lectures (Easy Start with Kubernetes, Learning Kubernetes with Pictures), it is impossible to teach everything about a product in a few dozen hours of online/offline lectures. However, all the core parts of Grafana are covered, and I am confident that there is no domestic lecture that covers it from this perspective.
We will also continuously update content that will be helpful from a business perspective.
Used in lectures Program and version & lecture sourceaddress
We are doing our best to provide students with a pleasant hands-on experience, but please understand that we may not be able to help with Vagrant-related errors that occur depending on individual environments .
(x86-64) For those who are having trouble with the hands-on training due to Vagrant -related errors, we provide an OVA image . (Download address provided at the bottom of lecture 2.3)
We provide Q&A, but the course fee does not include Q&A. However, if you are unable to practice or if there is any incorrect information, please let us know and we will take action as quickly as possible.
Recommended for these people
Who is this course right for?
Wanting to effectively visualize and monitor deployed Kubernetes.
For those curious about Grafana, a visualization tool already applied in the cloud.
Those who wish to transition from a paid monitoring system to a free monitoring system
Need to know before starting?
Knowledge at the level of an easy-to-start Kubernetes course
Knowledge level of an illustrated Kubernetes course
Hands-on Prometheus (Required)
Hello This is
1,244
Learners
51
Reviews
29
Answers
4.9
Rating
2
Courses
글로벌 소셜 플랫폼 기업에서 Site Reliability Engineer로 재직 중이며, 쿠버네티스 멀티 클러스터 관리 및 데이터베이스 플랫폼 운영을 주도하고 있다. CRD(Custom Resource Definition)를 기반으로 한 오퍼레이터 개발, 분산 데이터베이스 글로벌 리전 운영, 대규모 데이터 파이프라인 자동화 등 다양한 경험을 바탕으로 현업 엔지니어들이 쿠버네티스를 보다 효율적으로 활용할 수 있도록 지원하고 있다. 또한 ISMS-P, GDPR, CCPA 등 글로벌 보안 규제에 부합하는 데이터 라이프사이클 파이프라인을 설계·운영한 실무 경험을 가지고 있으며, 쿠버네티스 오픈소스 프로젝트에도 기여하고 있다.
더불어 국내 주요 대기업 및 클라우드 퍼스트 기업을 대상으로 클라우드 전환, 데이터 거버넌스 컨설팅, 보안 컴플라이언스 대응을 지원해왔으며, 국가기관의 클라우드 인프라 및 데이터 보안 관련 정책 자문에도 참여한 경험을 통해 실무와 연구를 동시에 이어가고 있다.

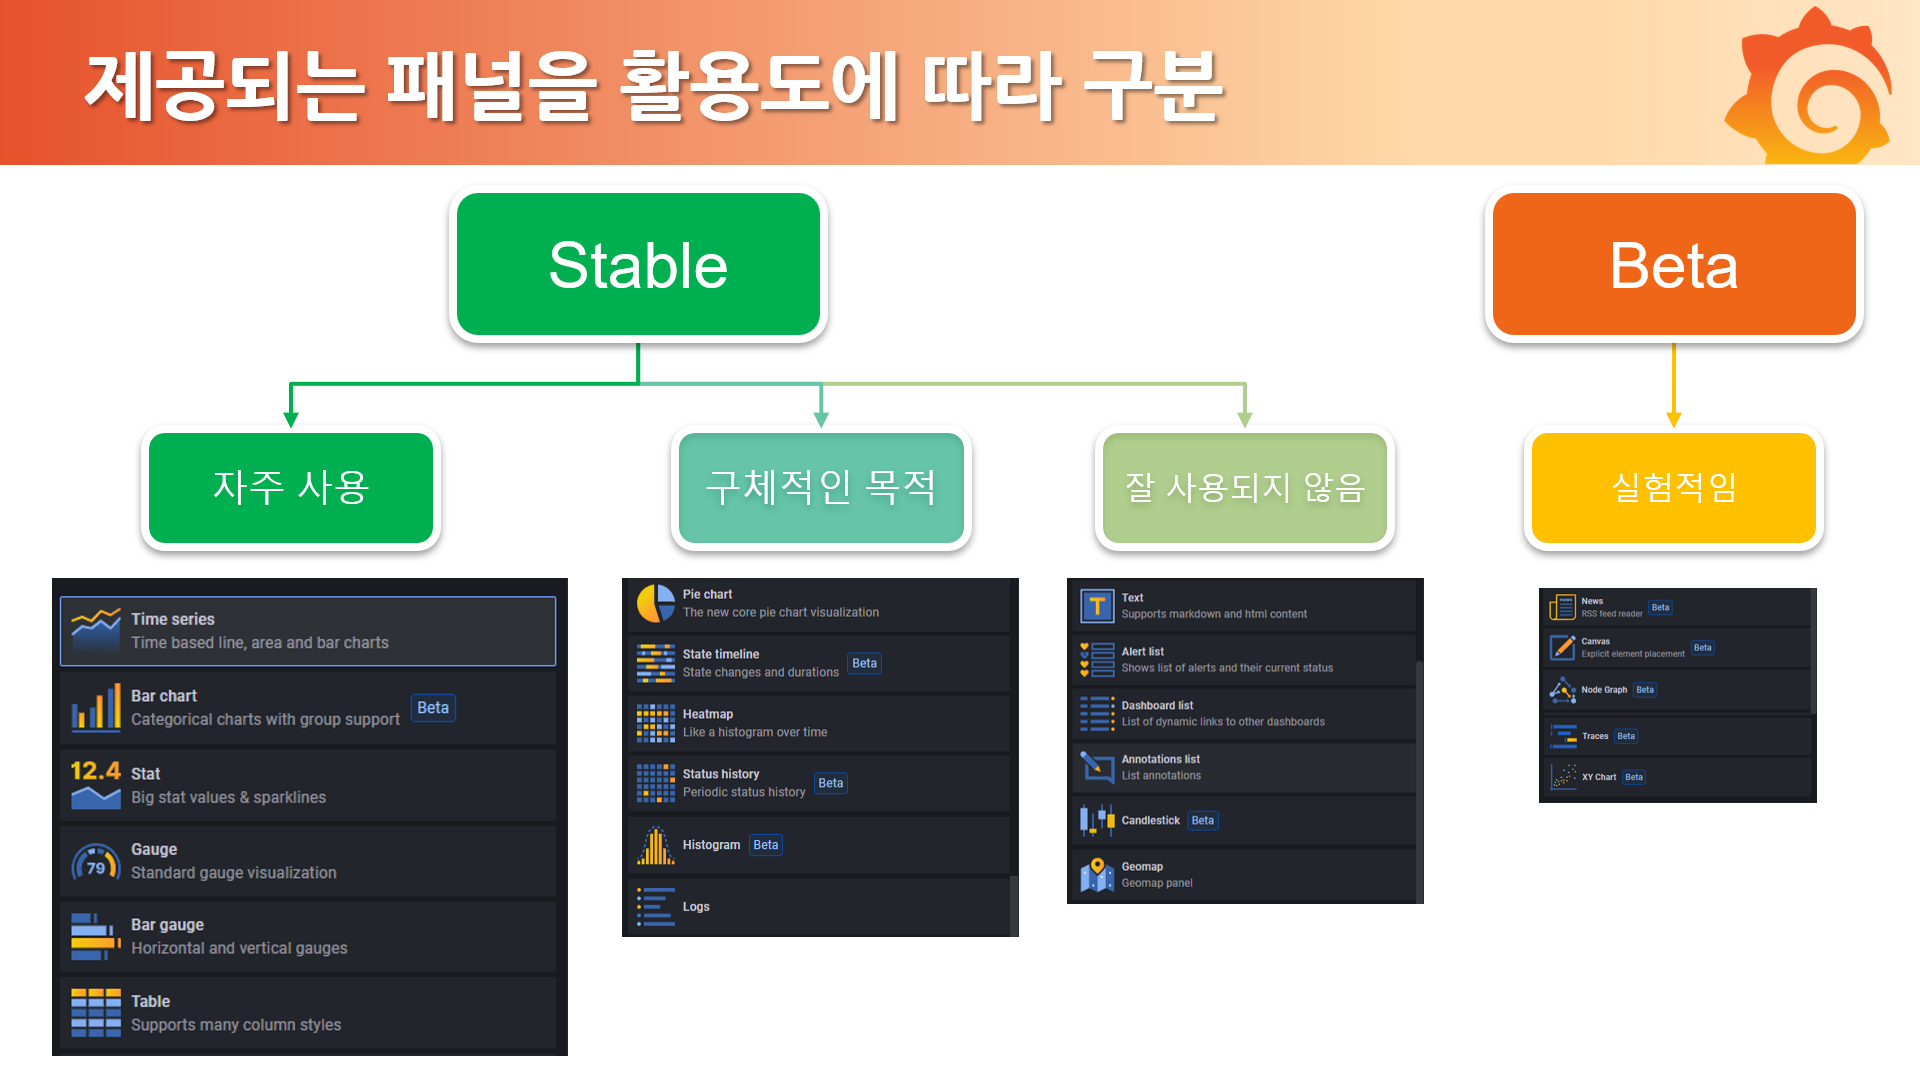 A diagram categorized by usability to help you easily understand the core elements of Grafana, the Panel.
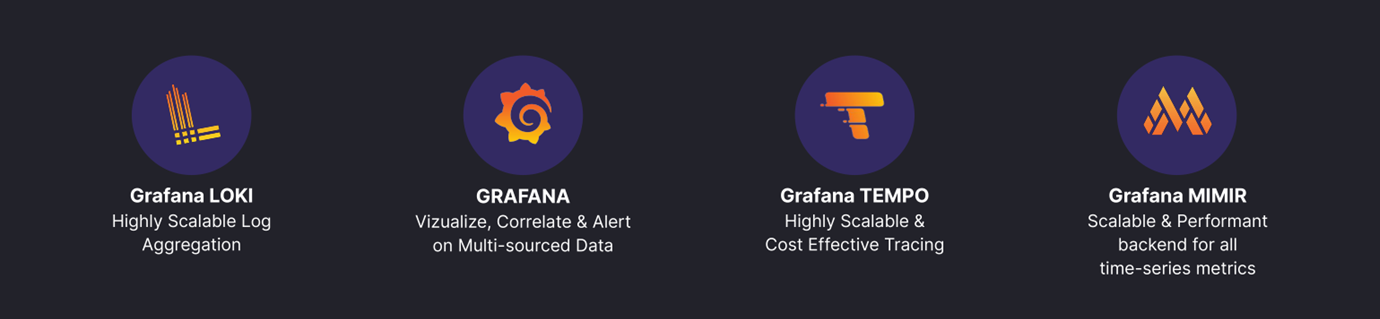 LGTM (Loki, Grafana, Tempo, Mimir) provided by Grafana
  Kubernetes Monitoring Dashboard Green with Grafana
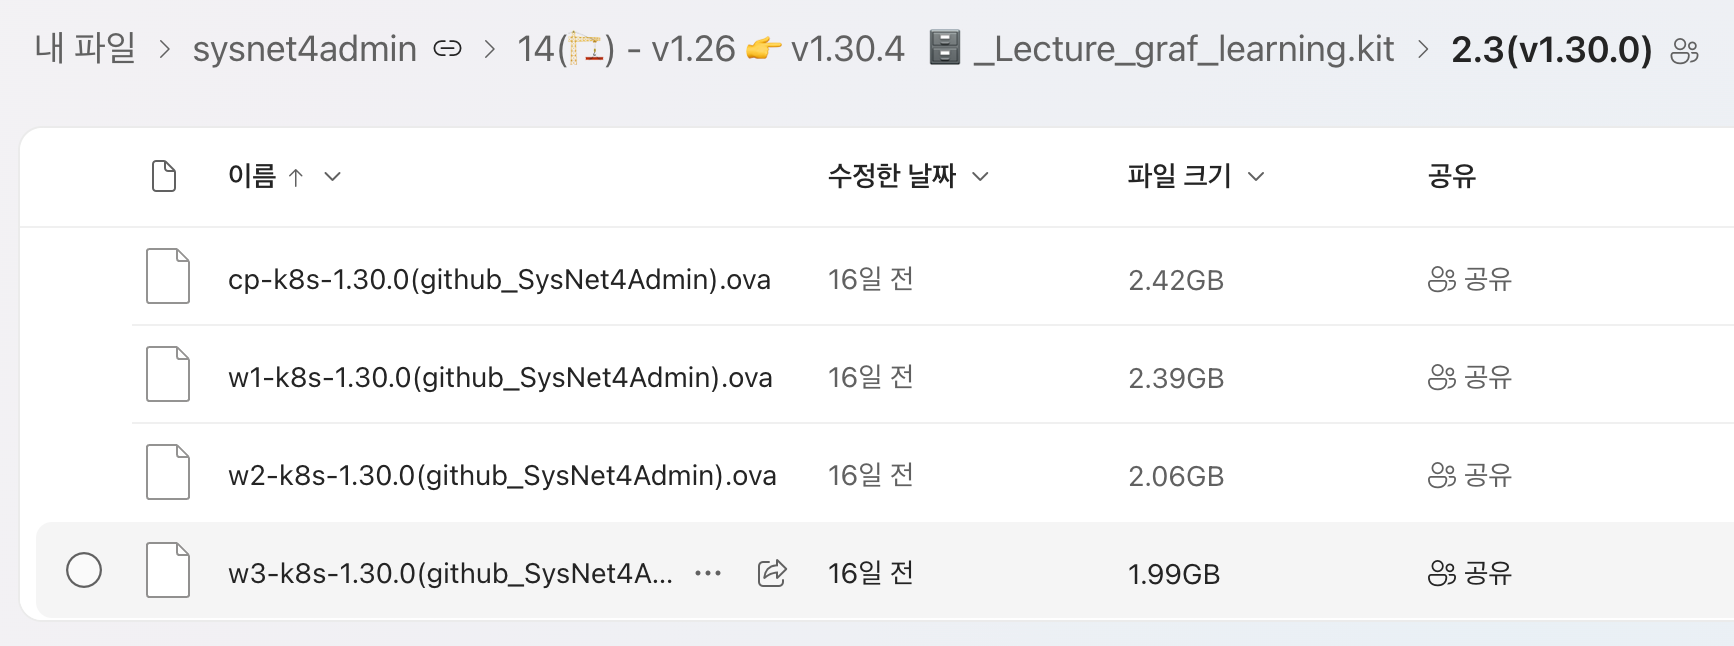
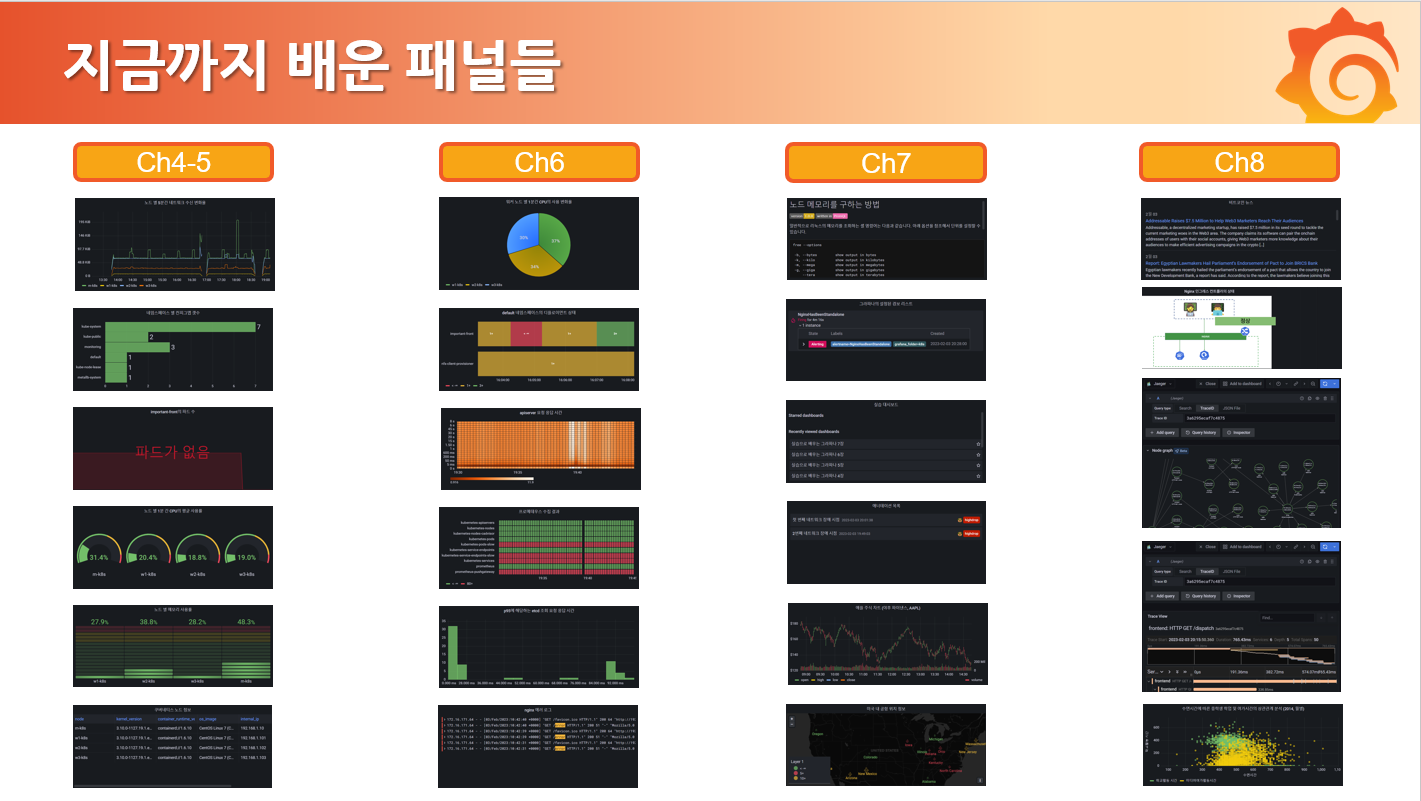 Various panels provided by Grafana