This course covers how to use queries to build dashboards in Logpresso. We will discuss how to visualize real-time data, trigger alerts, and dynamically drill down and filter as needed.
I learned that data can be easily created through queries and variously displayed in dashboard form.
5.0
jinwoo.lee
100% enrolled
I enjoyed learning about different ways to configure dashboards.
5.0
채호철
100% enrolled
It's a good lecture.
What you will gain after the course
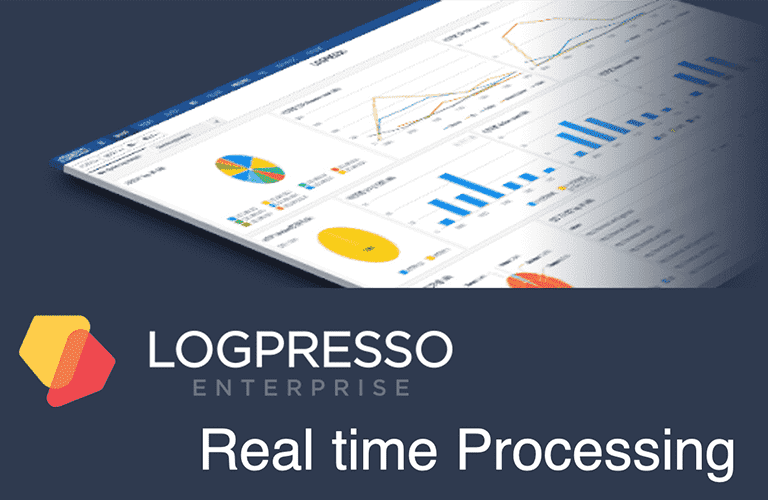
Real-time visualization
Big data visualization
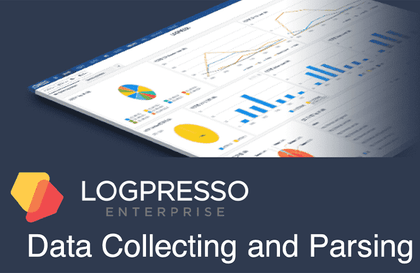
Logpresso Dashboard Features
Data charts composed of logpresso, Experience a more effective dashboard!
Introduction to the course
Logpresso is Developed with pure domestic technology It is a real-time big data platform.
Data visualization made easier.
Logpresso's basic feature , Dashboard, is highly useful because it allows you to easily organize data into charts using only queries. Of course, it is also meaningful to create multiple real-time charts and organize a dashboard.
However, Logpresso's dashboard has more hidden functions than that, so knowing them all at once can be useful for various data visualization tasks.
This lecture!
Are you an engineer who wants to freely visualize in real time with Logpresso? Do you want to visualize data appropriately to meet your detailed needs for each situation?
This lecture covers the entire functionality of the Logpresso dashboard. You can share the dashboard you created externally, drill down into the data to filter only the data you want to improve visual efficiency, or configure a real-time control environment based on big data through visual/auditory alarm functions.
We have organized a course where you can practice various functions supported by Logpresso. Learn about each function as well as how to use various functions in combination. We hope that this course will be the starting point for data visualization.
Learning Objectives
Learn about Logpresso's presets, widgets, and various chart features.
Covers how to create different types of dashboards.
Learn how to share dashboards built with Logpresso to other systems.
Learn several features of the drill-down filtering functionality in your dashboard.
Check out the features on how to set visual/audible alarms.
What to prepare
PC or laptop
You will need a Windows-based PC or laptop.
Chrome based browser
Logpresso allows you to perform all queries through the web console.
It can be used without any problems in browsers that support HTML5, such as IE 11 or higher, Chrome series (Edge, Whale, etc.), Firefox, Safari, etc. (However, Chrome series is recommended.)
Tools covered in the lecture
This course uses the Logpresso Enterprise Server version.
The data used in the lecture is included in the provided installation file. (See Inflearn class notes)
Expected Questions Q&A 💬
Q. Where can I get the query and logpresso installation files?
All queries used in the lecture are posted in the Inflearn lecture notes. The installation file is included as a resource for the course on setting up the practice environment.
Q. What do I need to attend the lecture?
This lecture covers data query and visualization of statistics. Therefore, understanding of data query and statistical functions is required. At least, it is recommended that you familiarize yourself with the 'Getting Started with Logpresso' course and take the lecture.
Founded in 2013, Logpresso is a big data specialist company that provides big data/AI analysis platforms to various industries, including security, telecommunications, finance, semiconductors, and logistics.


![[2026] SQLD All-in-One: Pass on Your First Try Even as a Non-MajorCourse Thumbnail](https://cdn.inflearn.com/public/files/courses/336953/cover/01kfq68bzb04w1mydc92ysfads?w=420)
![[Free] Basic Text Mining: App Review Analysis with Python (40-minute completion)Course Thumbnail](https://cdn.inflearn.com/public/courses/331163/cover/74cc657a-a8f9-4a78-8edb-0d5fcd4c4c75/331163.png?w=420)
![[2026] Yellow Book 176 Practice Problems for Those Who Find SQLD Questions DifficultCourse Thumbnail](https://cdn.inflearn.com/public/files/courses/336270/cover/01kfq647gtwqrwbjwbrn9rhn1t?w=420)


![Complete Guide to Data Analyst Job Preparation by Industry Professionals [Monthly Datarian Seminar Replay | September 2023]Course Thumbnail](https://cdn.inflearn.com/public/courses/331936/cover/9c693d54-1183-4dcf-bda8-a46e161c61d2/331936-eng.png?w=420)
![[Management Course #3] DE, DBA (SSIS, SSAS, MachineLearning, BI, ETL)Course Thumbnail](https://cdn.inflearn.com/public/courses/329784/cover/c5e6543b-72c3-4471-b43f-15b9002e65ed/329784-eng.png?w=420)

![[Marketing Archive] Big Data-Driven Marketing StrategyCourse Thumbnail](https://cdn.inflearn.com/public/files/courses/339225/cover/01k7e89h4d1fkmcr1bwfh1j33h?w=420)