inflearn logo

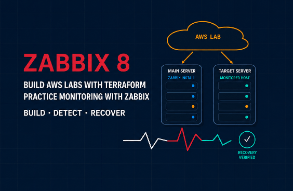
The Misfit’s Zabbix Adventure: Practical Zabbix 8 Monitoring with Terraform and AWS

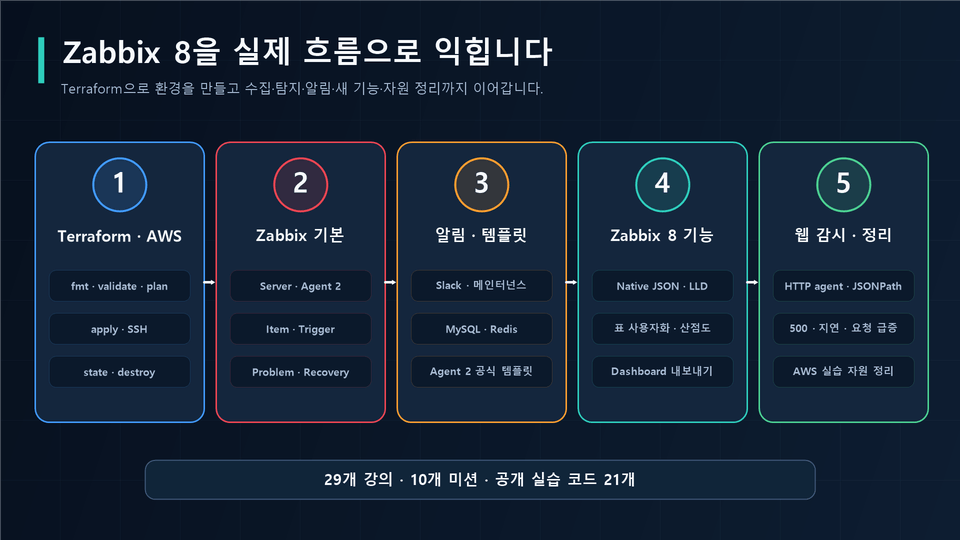
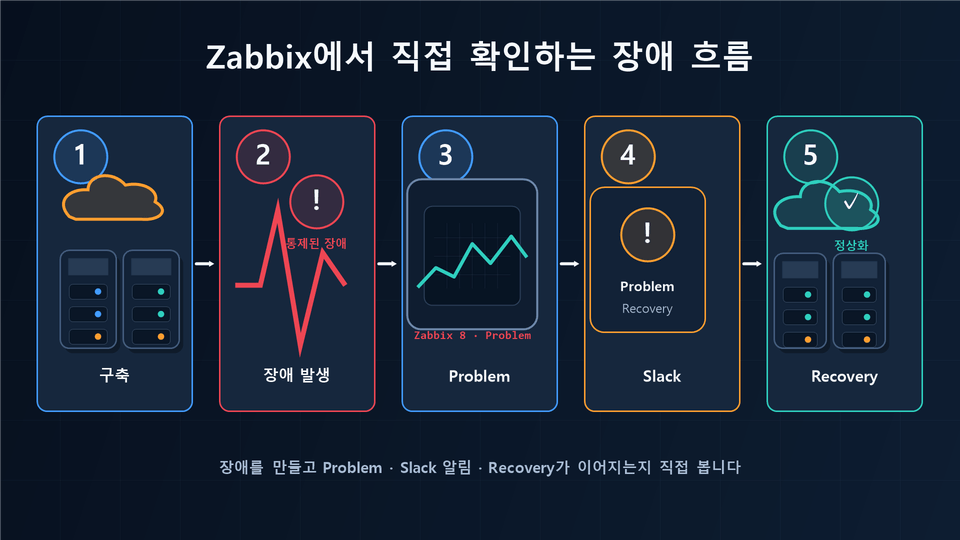
Build a hands-on AWS environment with Terraform and learn Zabbix 8’s new features and practical monitoring operations through exercises in fault detection, Slack notifications, and recovery. Store JSON values using Zabbix 8’s Native JSON, then split out the required values with Dependent items and JSONPath. Organize the display columns for recent data and the problem overview, and compare metrics using scatter plots and inverted graph axes. Export the completed Dashboard as YAML and import it again. This course also covers the Server, Agent 2, Item, and Trigger components required for existing Zabbix operations, along with problems and recovery, Slack notifications, maintenance, official MySQL and Redis templates, and Web scenarios. Create and recover CPU, disk, Apache, and HTTP problems yourself to connect the entire workflow. Create and clean up the AWS hands-on environment with Terraform. Follow the actual sequence: saving configuration files, running fmt, init, validate, and plan, applying the saved plan, connecting via SSH, checking the state, and cleaning up the practice resources.

1 learners are taking this course

Level Basic

Course period Unlimited

zabbix
zabbix
Terraform
Terraform
AWS
AWS
monitoring
monitoring
Linux
Linux
zabbix
zabbix
Terraform
Terraform
AWS
AWS
monitoring
monitoring
Linux
Linux

What you will gain after the course

  • You can prepare the Terraform configuration files, run fmt, init, validate, plan, and apply to create an AWS server, then proceed through SSH access, state verification, and destroy in one continuous workflow.

  • You can directly use Zabbix 8’s new features: Native JSON, table customization, scatter plots, and dashboard export and import.

  • You can partition Zabbix History·Trend tables, separate the Housekeeper role, and monitor key MySQL·Redis metrics and failure·recovery flows using the official Agent 2 templates.

  • You can distinguish between Zabbix Agent 2’s built-in plugins and loadable plugins, and monitor applications using the built-in MySQL and Redis plugins used in the course, along with the official templates.

What you’ll gain after completing the course

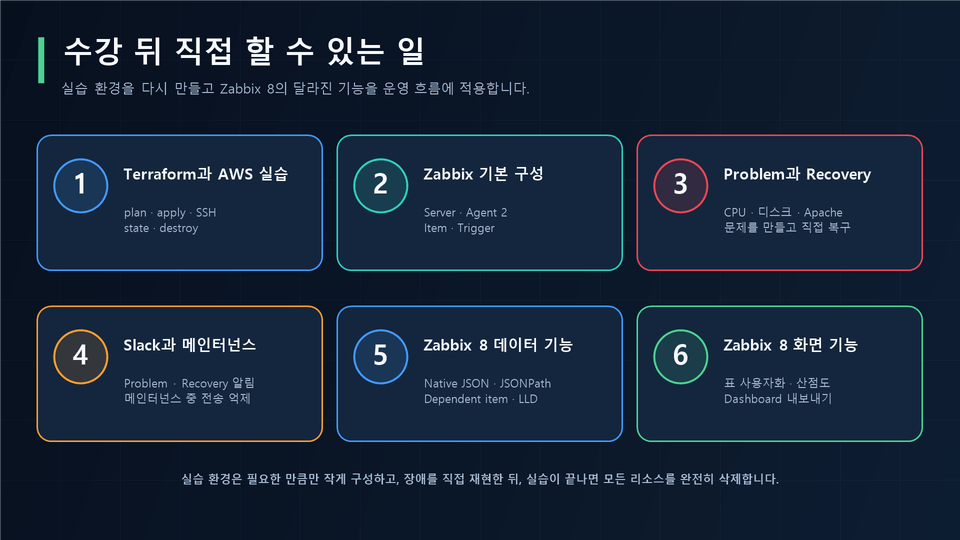
After completing the course, you will be able to distinguish between existing features carried over from Zabbix 7.4 and features changed in Zabbix 8. You will store JSON values using Native JSON and check how the system behaves when invalid JSON is entered. You will split the numeric and string values needed for Triggers using Dependent items and JSONPath. You will also practice connecting JSON arrays with LLD so that Items and Triggers are automatically created as repeated resources are added or removed.

In Recent data and Problem status, keep only the necessary columns and adjust their order and width. Use a scatter plot to examine the relationship between two metrics, and compare how the values appear when the graph axes are reversed. Export the completed Dashboard as YAML, then import it again to create a restored copy.

Save the Terraform configuration files, check the settings with init, validate, and plan, then apply the saved plan to create two AWS servers. Use the output values to SSH into each server and inspect the state. Once all the exercises are complete, apply the deletion plan saved from the same state and verify that the Terraform state and AWS practice resources are empty.

Configure the lab environment as minimally as necessary, reproduce the failure firsthand, and after completing all the labs, clean up the AWS lab resources created with Terraform in the course.

Course Content Introduction

Apply the new features of Zabbix 8 to real data.

Store the JSON response as Native JSON and split out the required values into Dependent items. Arrange the display columns for recent data and problem status in the desired order, and compare metrics using scatter plots and inverted graph axes. Export the dashboard as YAML, then import it again to restore the same configuration.

  • Store JSON values as an independent data type using Native JSON

  • Hide the display columns for recent data and incident status, and change their order and size.

  • Explore the relationships, clusters, and outliers between two metrics with a scatter plot

  • Compare inverted graph axes and improved Tooltip behavior

  • Export the Dashboard as YAML and import it again

  • Automatically cycle through multiple Dashboard pages with Slideshow

Continue in the same environment from installation through troubleshooting and recovery.

After installing Zabbix Server, perform the following tasks in order on the same Main and Target servers.

  • Install Agent 2 on the Target server and receive the first data using Passive and Active collection methods

  • Create CPU, disk, and Apache Triggers, then verify the process from Problem occurrence to Recovery.

  • Receive the failure alert and recovery alert for the same incident once each via Slack

  • During maintenance, suppress only Slack notifications while retaining data and event history.

  • Connect the official MySQL and Redis templates, and verify key values and problem and recovery notifications.

  • Collect JSON data and recurring resources using Native JSON, Dependent items, and LLD

  • Distinguish HTTP 500 errors, 3-second delays, and request spikes with a web scenario, and recover from each one.

  • Verify that the Terraform state and AWS lab resources have all been cleaned up in the final lesson.

In each failure exercise, you create the problem yourself and check how the values change. You follow the entire flow, from the Trigger creating a Problem to the same event changing to Recovery.

1. Preparing a hands-on environment with Terraform and AWS

Compare the criteria for choosing between Zabbix and Prometheus based on what is being monitored, the speed of environmental changes, the operational structure, and the management burden the team can handle.

For Windows, prepare WSL2 Ubuntu; on macOS and Linux, use each operating system’s terminal. After installing Terraform and the AWS CLI, connect your personal AWS account. Learn the sequence for actually creating and cleaning up an AWS server, from saving the configuration file through fmt·init·validate·plan, applying the saved plan, connecting via SSH, checking the state, and running destroy.

2. Official Package Installation and MySQL Partition Management

In the Zabbix official download selector, select the combination of Zabbix 8.0, Ubuntu 26.04, Server·Frontend·Agent, MySQL, and Apache. Install the Server, Frontend, DB, and Web UI in the order recommended on the official page.

The five History tables are partitioned by day, and the two Trend tables by month. We’ll also cover creating future partitions, deleting partitions past the retention period, cron execution and logs, pMAX protection, and separating the roles of History·Trend and Housekeeper.

Create and Clean Up an AWS Practice Environment with Terraform

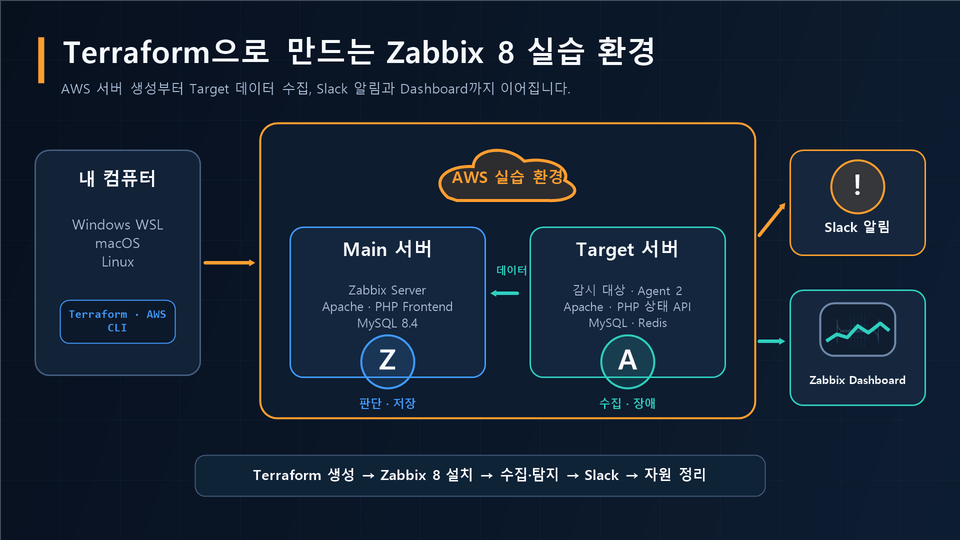
Prepare Terraform and the AWS CLI on Windows WSL, macOS, and Linux, and connect your personal AWS account. Save the publicly available Terraform configuration files, then check them first with fmt, init, validate, and plan, and apply the saved plan to create two Ubuntu servers. Rather than memorizing Terraform commands separately, you will use them repeatedly throughout the actual creation, connection, and cleanup process.

Install Zabbix Server, the frontend, and MySQL for Zabbix on the Main server. On the Target server being monitored, configure Agent 2, an Apache/PHP status API, MySQL, and Redis. When monitoring data arrives from the Target server at the Main server, Zabbix stores the values and evaluates the trigger conditions.

After completing all the labs, apply the saved destroy plan from the same Terraform folder and state. The Terraform lab in this course is complete once you have confirmed an empty state and zero AWS lab resources.

Check the class notes below the video for each lecture.

When taking each lecture, be sure to expand and check the lesson notes below the video.
For lectures that include hands-on practice code, there is a “View the practice code for this lecture” link. Clicking the link takes you directly to the location containing the code and explanations used in that lecture, rather than to the public blog’s homepage.

Even lectures without coding exercises may include guidance that supplements the video content, so don’t skip the lesson notes—be sure to check them.

Instead of reading through code at length, the video explains where and in what order to run commands, what the expected results are, and what to check first when problems occur. You can copy and use the commands and settings needed for the exercises from the class notes.

You'll learn the following:

3. Agent 2, Item, Trigger, and Failure Flow

Install Agent 2 on the Target server being monitored, and examine the differences between Passive and Active collection methods through their actual connection directions and configuration files. Create basic Items and read recent values, update times, History and Trend, and graphs.

Next, we safely create CPU, disk, and Apache issues. We compare how the Trigger condition, severity, Problem, acknowledgment, action notes, and Recovery are linked within a single incident.

4. Slack notifications, maintenance, and official templates

Connect the Media for the Slack Incoming Webhook to a dedicated notification user. Configure a generic Trigger Action so that one notification is sent for the problem and one for the recovery.

During maintenance, Zabbix data and event history are retained, while only Slack notifications are stopped. For MySQL and Redis, connect the official plugins included with Zabbix Agent 2 and the official templates to monitor key values and verify problems and recoveries.

5. Zabbix 8 Native JSON and LLD

Using Zabbix 8’s Native JSON data type, we store JSON values and check how invalid JSON is handled. We split the values to be used in triggers using dependent items and JSONPath.

Connect a JSON array and LLD macros to a Discovery rule. Using item prototypes and trigger prototypes, verify how the same collection and evaluation rules are automatically applied even when the number of recurring resources increases or decreases.

6. Zabbix 8 Table, Scatter Plot, and Dashboard Features

In Recent data and Problems, keep only the necessary display columns and change their order and size. Use a scatter plot to examine the relationship between two values, and compare graph axis inversion and Tooltip behavior. After creating a Dashboard that shows current problems, affected targets, and trends, export it as YAML and import it again. Multiple pages are automatically switched using Slideshow.

7. Web Service Monitoring and Practice Environment Cleanup

In the final web exercise, you create a small JSON status API and use a single HTTP agent to store multiple values separately. Using a web scenario and dedicated request logs, you distinguish HTTP 500 errors, 3-second delays, and request spikes as different problems, then recover from them yourself.

After all hands-on exercises are complete, check the same Terraform folder and state. Apply the saved deletion plan as-is, then confirm that the state is empty and there are 0 AWS lab resources.

Pre-Course Notes

Lab environment

  • A personal AWS account is required. Company or school organizational accounts and IAM Identity Center are not used as the default path for the course.

  • On Windows, use WSL2 Ubuntu. On macOS, use the macOS Terminal without installing WSL. On Linux, use the actual Linux terminal.

  • The course’s actual local screens were recorded using Windows WSL2 Ubuntu Bash as the reference environment. Installation commands for macOS and Linux are provided separately in the course notes.

  • The server exercises use a combination of Ubuntu 26.04 LTS, MySQL 8.4, Apache, and Zabbix Agent 2.

  • Please prepare a Windows 10/11 or recent macOS/Linux environment, along with a web browser and code editor.

Required Fundamentals

  • You should be able to navigate folders with cd in the terminal and run commands with sudo.

  • You should be able to open and save configuration files using vi or a text editor you are familiar with. hoặc trình soạn thảo văn bản quen thuộc.

  • The practice includes starting and stopping services and checking their status with systemctl, as well as viewing service logs with journalctl..

  • No prior experience with Zabbix is required. However, this is not a beginner-level course that teaches Linux commands and networking fundamentals from the ground up.

AWS costs

The hands-on lab environment does not create a NAT Gateway, RDS, ALB, or EKS. Instead, it uses two EC2 instances—a Main server with Zabbix installed and a Target server to be monitored—only when needed. The instructor’s validation environment was designed with a target of less than $10 per month.

Actual costs vary depending on the region, usage time, taxes, exchange rates, data transfer, and whether resources are deleted. Costs of $10 or less are not guaranteed. If you leave the instances running or retain the EBS volumes, charges may continue to accrue, so be sure to follow the cleanup lesson after completing all the hands-on exercises.

Version Information

The filming and validation version of this course was created based on the Zabbix 8.0.0beta2 prerelease and Ubuntu 26.04 LTS. As of September 3, 2026, when the final review of the course is being conducted, the official Zabbix 8 documentation is still marked as a development version.

Secrets

Use your own AWS Access Key, Secret Access Key, Slack Webhook URL, and practice password. Instead of using the AWS root account, create and prepare an IAM user for the exercises.

Recommended for those who:

  • System and infrastructure engineers installing Zabbix for the first time who want to receive data from actual servers

  • Those who have experience installing it but weren’t sure how to connect Items, Triggers, and Templates.

  • Those who want to practice everything in one go—from checking the cause after receiving a failure alert to recovery and confirming the recovery.

  • Those who want to configure Zabbix History and Trend partitioning, create future partitions, delete partitions past their retention period, and separate Housekeeper responsibilities themselves.

  • Those who want to apply the official MySQL and Redis templates, as well as JSON and LLD, to actual production targets

  • Those who want to configure Slack notifications and Dashboards together to organize their operational views

  • Those who want to update their Zabbix 7 experience with Zabbix 8’s Native JSON, table customization, scatter plots, and Dashboard export/import workflows

  • Those who want to learn the basics of Terraform through the process of creating, accessing, and cleaning up actual AWS servers, rather than learning Terraform in depth from the ground up

  • Those who want to practice everything at once in a small AWS environment—from creating servers to handling failures, recovery, and resource cleanup

This may not be suitable for those who want to learn Linux commands and networking basics very slowly, or who want to complete all exercises using only a local PC without a personal AWS account or paid cloud services.

  • Those who want to learn Linux commands and network fundamentals very slowly from the beginning

  • Those who want to complete all hands-on exercises using only a local PC, without a personal AWS account or paid cloud services.

  • Those expecting Grafana, Loki, Kubernetes, and Ansible setup to be the main focus of this course

  • Those who may find it difficult to accept that some parts of the prerelease interface may change in the official version

Instructor Introduction

Hello. I have over 21 years of experience as an infrastructure and systems engineer, as well as a DevOps and SRE engineer, building and operating Zabbix-based monitoring systems.

I have collected, analyzed, and operated data from various targets needed in operational environments using Zabbix, including applications, operating systems, networks, databases, hardware, and power consumption. I have also configured and tuned MySQL partitions, and collected, analyzed, and operated key metrics for Grafana dashboards, Kubernetes workloads, SNMP devices, and related systems such as MySQL, MongoDB, Elasticsearch, Redis, and Kafka.

I document the implementation methods I have applied and validated in real-world environments, along with my incident response experience, on the IT technology blog Quirky Guy. I organize and share commands, configuration methods, and operational checkpoints that can be used directly in the field from a practitioner’s perspective.

Blog: https://quirky-guy.com

Recommended for
these people

Who is this course right for?

  • System and infrastructure engineers installing Zabbix for the first time who want to receive data from actual servers

  • Those who have experience installing it but weren’t sure how to connect Items, Triggers, and Templates.

  • Intermediate or advanced operators experiencing DB and server load caused by Zabbix Housekeeper and wanting to implement History/Trend partitioning and role separation

  • Those who want to reduce repetitive manual configuration and use Native JSON, Dependent items, and LLD for practical monitoring

Need to know before starting?

  • You should be able to navigate folders with `cd` in the terminal and run commands with `sudo`. No Terraform experience is required.

  • Intended for beginners and above, and requires basic knowledge of infrastructure such as Linux, AWS, and networking.

  • You should be able to open and save the configuration file using `vi` or a familiar text editor.

  • The hands-on exercise includes starting and stopping services and checking their status with `systemctl`, as well as viewing service logs with `journalctl`.

  • On Windows, use WSL2 Ubuntu. On macOS, use the macOS Terminal without installing WSL. On Linux, use the actual Linux terminal.

Hello
This is jikimy754557

Career Verified

Hello. I have over 21 years of experience as an infrastructure and systems engineer and as a DevOps and SRE engineer, during which I have built and operated Zabbix-based monitoring systems.

I have collected, analyzed, and operated data from various targets needed in operational environments using Zabbix, including applications, operating systems, networks, databases, hardware, and power consumption. I have also configured and optimized MySQL partitions, and collected, analyzed, and operated key metrics for Grafana dashboards, Kubernetes workloads, SNMP devices, and related systems such as MySQL, MongoDB, Elasticsearch, Redis, and Kafka.

I document the implementation methods I have applied and verified in real-world environments, along with my incident response experience, on the IT tech blog Quirky Guy. I organize and share commands, configuration methods, and operational checkpoints that can be used immediately in the field, from a practitioner's perspective.

Blog: https://quirky-guy.com

More

Curriculum

All

29 lectures ∙ (3hr 53min)

Published: 
Last updated: 

Reviews

Not enough reviews.
Please write a valuable review that helps everyone!

Similar courses

Explore other courses in the same field!

Limited time deal

$20,790.00

30%

$23.10