Learning JavaScript through games
nomad
This course will help you develop the basics and practical skills of JavaScript while creating your own game program.
Beginner
JavaScript
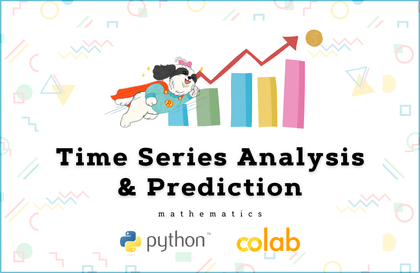
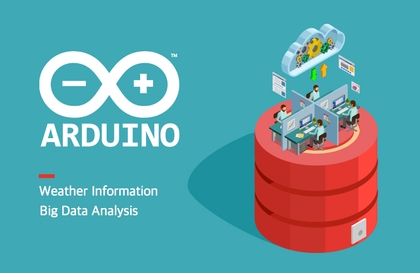
This is a machine learning and deep learning project preparation course that uses Python to process Boston Marathon big data into the desired format and uses various charts and technologies to create valuable information.
Reviews from Early Learners
5.0
권오현
thank you
5.0
이화영
It was easy to understand because it explained the basic concepts one by one calmly :) When I looked at other visualization lectures on Inflearn, there were many cases where the explanations were omitted, making it difficult to understand the lectures. This lecture seems easy to follow if you only know the basics of Python.
5.0
박민정
This is a great course for building a solid foundation in data visualization and pandas.
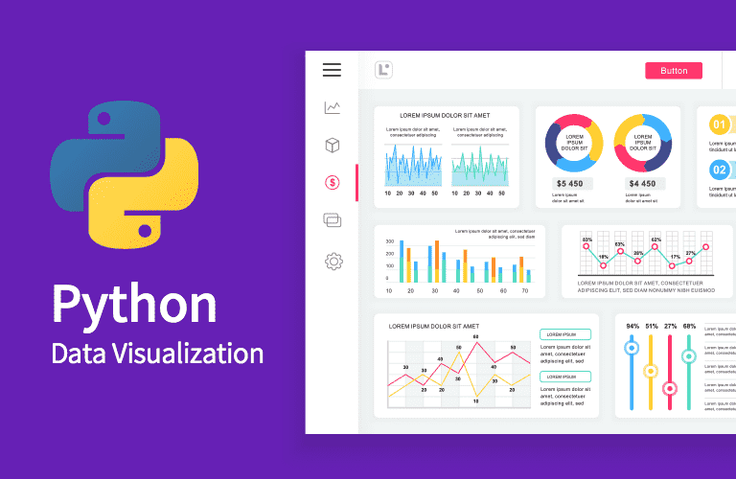
Data Analysis Using Python
Data processing for machine learning and deep learning
Data processing and analysis with Python Pandas
Learn 5 Key Uses for Charts
Understanding and developing 10 key charts
Designing Data Visualization Analysis Techniques
Use appropriate charts and visualization techniques for various analyses
Understanding data visualization and charts
It can be used in various projects such as machine learning and deep learning using Python's Pandas, Matplotlib, and Seaborn.
Learn data visualization and analysis techniques all at once.

Boston Marathon Big Data Using Python
Process it into the desired shape and use various charts and techniques.
This is the process of preparing machine learning and deep learning projects to create valuable information.
Manipulate data as you like using Python Pandas.
Let's create 10 charts using various Python libraries.
Learn active GUIs, animations, and more for better data visualization.
Please look forward to future lectures on machine learning, deep learning, IoT, and more, all utilizing data visualization.
The materials and program sources used in the lecture can be found on the website Creapple (www.creapple.com), a knowledge learning platform I run.

Who is this course right for?
For those preparing for machine learning/deep learning projects
Anyone working on a data analysis project
Anyone interested in data visualization
Those who feel the limitations of Excel analysis
For those who want to analyze using appropriate charts
Need to know before starting?
Python 100-minute core lecture
Willingness to study hard
22,403
Learners
506
Reviews
556
Answers
4.4
Rating
25
Courses
A deep-tech company recognized by South Korea and NVIDIA, and a fintech startup chosen by Singapore, we realize your potential on the global stage.
Nomad Creator is transcending individual growth to leap forward as a startup, providing professional IT lectures on the global stage.
Our journey, which began in 2019 through the Singapore government's Entrepass Innovator program, soon expanded into the story of an innovative startup.
In 2020, we established ourselves as a leader in the deep-tech sector by developing AI fintech solutions in South Korea, achieving various global recognitions and milestones, including the NVIDIA Collaboration Program Best Project and the ASUS Global Startup Challenge Award.
In 2023, with the support of NVIDIA, we established a company in the United States, beginning our leap toward the global market.

Prior to founding my startup, I built practical experience and expertise over 25 years at companies such as LG CNS and T-money, leading global projects as a System Engineer, Project Manager, and IT Consultant.
Based on professional certifications such as PMP, SAP BW, SCJP, MCSE+DBA, and OCP-DBA, I have continued to take on successful challenges in various fields, including program development, project management, and IT solution design., tôi đã tiếp nối những thử thách thành công trong nhiều lĩnh vực khác nhau như phát triển chương trình, quản lý dự án và thiết kế giải pháp IT.
Now, Nomad Creator integrates this experience and know-how to provide educational content that anyone can learn easily and enjoyably. From practice-oriented lectures to professional courses reflecting the latest technology trends, we offer customized learning for individual growth.
Through the fusion of technology and education, we help more people realize their own potential.
With Nomad Creator, your dreams are no longer out of reach.
Even at this very moment, someone is learning something new and striving to become a better version of themselves.
But how often do you lose precious time trying to find the knowledge you need amidst a flood of information?
Nomad Creator aims to solve this problem.
We creatively weave knowledge together to provide an experience that saves time and maximizes value. Our goal goes beyond simple information delivery; we aim to deliver knowledge as beautifully as a work of art.
With Nomad Creator, your learning will become easier, faster, and produce more valuable results., việc học của bạn sẽ trở nên dễ dàng hơn, nhanh chóng hơn và tạo ra những kết quả giá trị hơn.
"Adding value to the journey of learning, Nomad Creator."
This is the future we dream of.
All
37 lectures ∙ (6hr 22min)
29. Making Histogram
09:13
All
28 reviews
4.2
28 reviews
Reviews 6
∙
Average Rating 4.8
Reviews 1
∙
Average Rating 5.0
5
It was easy to understand because it explained the basic concepts one by one calmly :) When I looked at other visualization lectures on Inflearn, there were many cases where the explanations were omitted, making it difficult to understand the lectures. This lecture seems easy to follow if you only know the basics of Python.
Thank you. I will try to create data visualizations on the same topic using JavaScript and R in the future with your support.
Reviews 2
∙
Average Rating 1.5
1
You spend too much time talking about useless things. You're talking about R, but what about people who haven't used R? I don't want to know R and I have no intention of learning it. You can expect it to be centered around Python, but you're talking about R... Is this an R lecture? In addition, using Anaconda is good, but later, when you create a virtual environment with Jupyter Notebook, you'll have to install each one with pip anyway. There may be a way to install all the virtual environments (is there? I don't know). (Here, I won't mention the virtual environment, which is essential for Python.) In addition, on ARM-based systems that Anaconda doesn't support, you have to do everything manually, but it's so easy to move on to Anaconda, so why waste time talking about R? I'm watching this as a prelude to watching the TensorFlow lecture later, but if I just skip over it like this, what am I supposed to do if I want to run tensorflow on an ARM-based system? I'm starting to feel like I'm wasting my money. I was going to watch the lecture because I didn't want to bother reading the book, so... Ugh.
I usually don't comment on bad reviews, but I think this review is excessive, so I'm responding. First of all, R is as important a language for data visualization as Python, so I explained it here and there for those who need it, but I don't know how much time was spent to make such a comment. Also, Anaconda is a software used not only in this lecture but also in most lectures on data analysis using Python, so I don't understand why you're taking issue with it. This course is a beginner's course, so it doesn't cover virtual environments, but it's covered in other advanced project courses, and I can't agree with the fact that it talks as if a virtual environment is essential. I excluded it because I thought it would be confusing in the basic course, and you can learn the content of the course sufficiently even without a virtual environment. Each lecture has its own purpose and level. This course covers data visualization and manipulation with Python. There are separate courses that cover TensorFlow and machine learning. It's clearly stated in the lecture title and introduction, so I don't know why you're complaining that it has nothing to do with the course and that you can't learn TensorFlow. Looking at the student ID, I saw that you left similar negative reviews and low ratings for my previous 'Python 100-Minute Core Course', so I don't understand why you are taking my insufficient lectures repeatedly and leaving such reviews. No matter how many different perspectives there are in the lectures, I hope you will be careful when making your reviews, considering the position of the instructor who worked hard to create the lectures, and the lecture topics and purposes.
Simply put, beginners don't know anything. They have to teach everything. So they watch the lecture. However, the lecture only works in a specific environment. Beginners think, "Huh? My environment is different. What should I do?" and give up or search the Internet endlessly. If this happens, isn't there no reason to pay for the lecture? The reason for paying for the lecture is to save time and effort by searching for this and that. However, the part that must be mentioned in the lecture, such as installing the package with pip... (Pandas, which appears here, can be installed by just pip install pandas, but if you look at the lecture content, it says to go to the Pandas homepage and install it yourself if you want to install it individually.) What should subscribers who have development boards that are not supported by Anaconda (such as NVIDIA's Jetson Nano board or even Raspberry Pi) do? Just install Anaconda... This kind of thing... I know it all. It's convenient if you install Anaconda. The problem is that there are environments that do not support Anaconda. Especially if the CPU is ARM series. Linux series only supports x86_64 series and IBM Power9 (if you look at the Anaconda website download). In addition, if it is truly for beginners, it is natural to mention virtualization, so that later subscribers will think that they should try using such technology. I think that the more beginners are, the more necessary technologies should be mentioned at least once. R You could mention it. But you didn't mention virtualization, which is a really necessary technology. If it is a Python course, you should focus on Python first. Wouldn't it be more reasonable to suggest virtualization or an installation method using pip when mentioning R? And to download the materials needed for the course, you have to sign up for a site created by the instructor.. I guess that's because it is a free course. However, since it is a paid lecture, I wonder if having to sign up for another site to download the materials needed to watch this lecture and practice is a trick to increase the number of members of the site operated by the instructor. (For reference, when you read books, there are cases where you have to download source code or materials, but most of them are downloaded without signing up.) I feel very sorry that I have to provide my personal information to the instructor to download the materials for the lectures I pay for. I don't think this is a fair action that an instructor who makes money through paid lectures should take toward subscribers. Finally, while watching the lectures, people keep asking why I keep writing bad reviews... I want a refund too. But at first, I paid for all the lectures (6 lectures from Python Basics to TensorFlow). I watch them when I have time because I feel bad about wasting money. And it's called a bad review, but I didn't just write, "This lecture sucks." I wrote down the reasons, but rather than thinking about correcting them after seeing them, it's a shame to express my dissatisfaction by calling them bad reviews. The purpose and level are good words. However, even for beginners, there are some parts that are absolutely necessary. Just as the instructor thinks that R is worth mentioning, I think it's like installing using pip or virtualization. I think it's putting the cart before the horse to mention R, but not mentioning one of Python's core functions, installing using pip, and virtualization. I'm not asking you to explain virtualization. Just mentioning it like you mention R would be a huge help to beginners.
Reviews 19
∙
Average Rating 4.6
Reviews 3
∙
Average Rating 4.0
4
It's easy to approach at first, but the difficulty level increases as you go on.. I would appreciate it if you could explain the function description in more detail. If you don't understand something, you can search it on Google, but you can think of this as studying too...ㅎㅎ.. In the next lecture, I hope you will cover data visualization processing techniques using Sql...
Hello? Thank you for your kind words. I will explain the function more thoroughly next time as you advised. Next time, I will create a topic like data visualization using JavaScript, and at that time, I will use alasql, which is SQL corresponding to Pandas. I plan to use Google Chart and D3.js. I hope the new lecture will be helpful. Thank you for your hard work in the lecture.
Check out other courses by the instructor!
Explore other courses in the same field!


![[OpenCV] Python Deep Learning Image Processing Project 2 - Find the Bad Apples!Course Thumbnail](https://cdn.inflearn.com/public/courses/325290/course_cover/0f6dc5fe-e6e6-414a-af6d-10f589e50788/openCV-dnn2-rotten-apple-eng.jpg?w=420)
![[Mobile] Deep Learning Computer Vision Practical ProjectCourse Thumbnail](https://cdn.inflearn.com/public/courses/324985/course_cover/6bedded2-1f32-4d11-be03-6e5bf5a3b488/sjh-mobile-cv.png?w=420)
![[Raspberry Pi] IoT Deep Learning Computer Vision Practical ProjectCourse Thumbnail](https://cdn.inflearn.com/public/courses/324813/course_cover/eb51871d-082a-4b77-add0-f87421aaac46/sjh-IoT.png?w=420)
![[OpenCV] Python Deep Learning Image Processing Project - Find Son Heung-min!Course Thumbnail](https://cdn.inflearn.com/public/courses/324508/course_cover/067408c8-819a-4a84-bd51-0ffb20a4ec3d/sjh_opencv.png?w=420)
![[Tensorflow2] Complete conquest of Python deep learning - Latest techniques of GAN, BERT, RNN, CNNCourse Thumbnail](https://cdn.inflearn.com/public/courses/324484/course_cover/f6f03229-d156-4a27-a0f2-ede2361c586f/sjh_Deep_Learning.png?w=420)

![[Tensorflow2] Complete conquest of Python machine learning - Marathon record prediction projectCourse Thumbnail](https://cdn.inflearn.com/public/courses/324207/course_cover/1a79c7dc-1624-4d3a-95ff-79ba1e9c4025/python_machine_learning.png?w=420)

![[Renewed] Python Machine Learning Bootcamp for Beginners (Easy! Learn by Solving Real Kaggle Problems) [Data Analysis/Science Part2]Course Thumbnail](https://cdn.inflearn.com/public/courses/327464/cover/55c4db7b-7764-43cc-ac75-d9e8d08098f1/327464-eng.png?w=420)

![[Side Project After Work] Big Data Analysis Certification Practical Exam (Type 1, 2, 3)Course Thumbnail](https://cdn.inflearn.com/public/courses/329972/cover/dcfb28fd-48c1-4bb1-ab31-d59eac874194/329972-original.png?w=420)
![[Renewal] First-time SQL and Database (MySQL) Bootcamp [From Beginner to Application]Course Thumbnail](https://cdn.inflearn.com/public/courses/324208/cover/85872a8e-d2bb-4c43-82fc-d55fa067746e/324208.png?w=420)