


![[TeddyNote] Pandas in One Shot (Includes E-book)강의 썸네일](https://cdn.inflearn.com/public/courses/327864/cover/1c1b9c75-243a-48ac-af65-38a1c735bcb1/pandas.png?f=avif&w=420)
[TeddyNote] Pandas in One Shot (Includes E-book)
learnaday
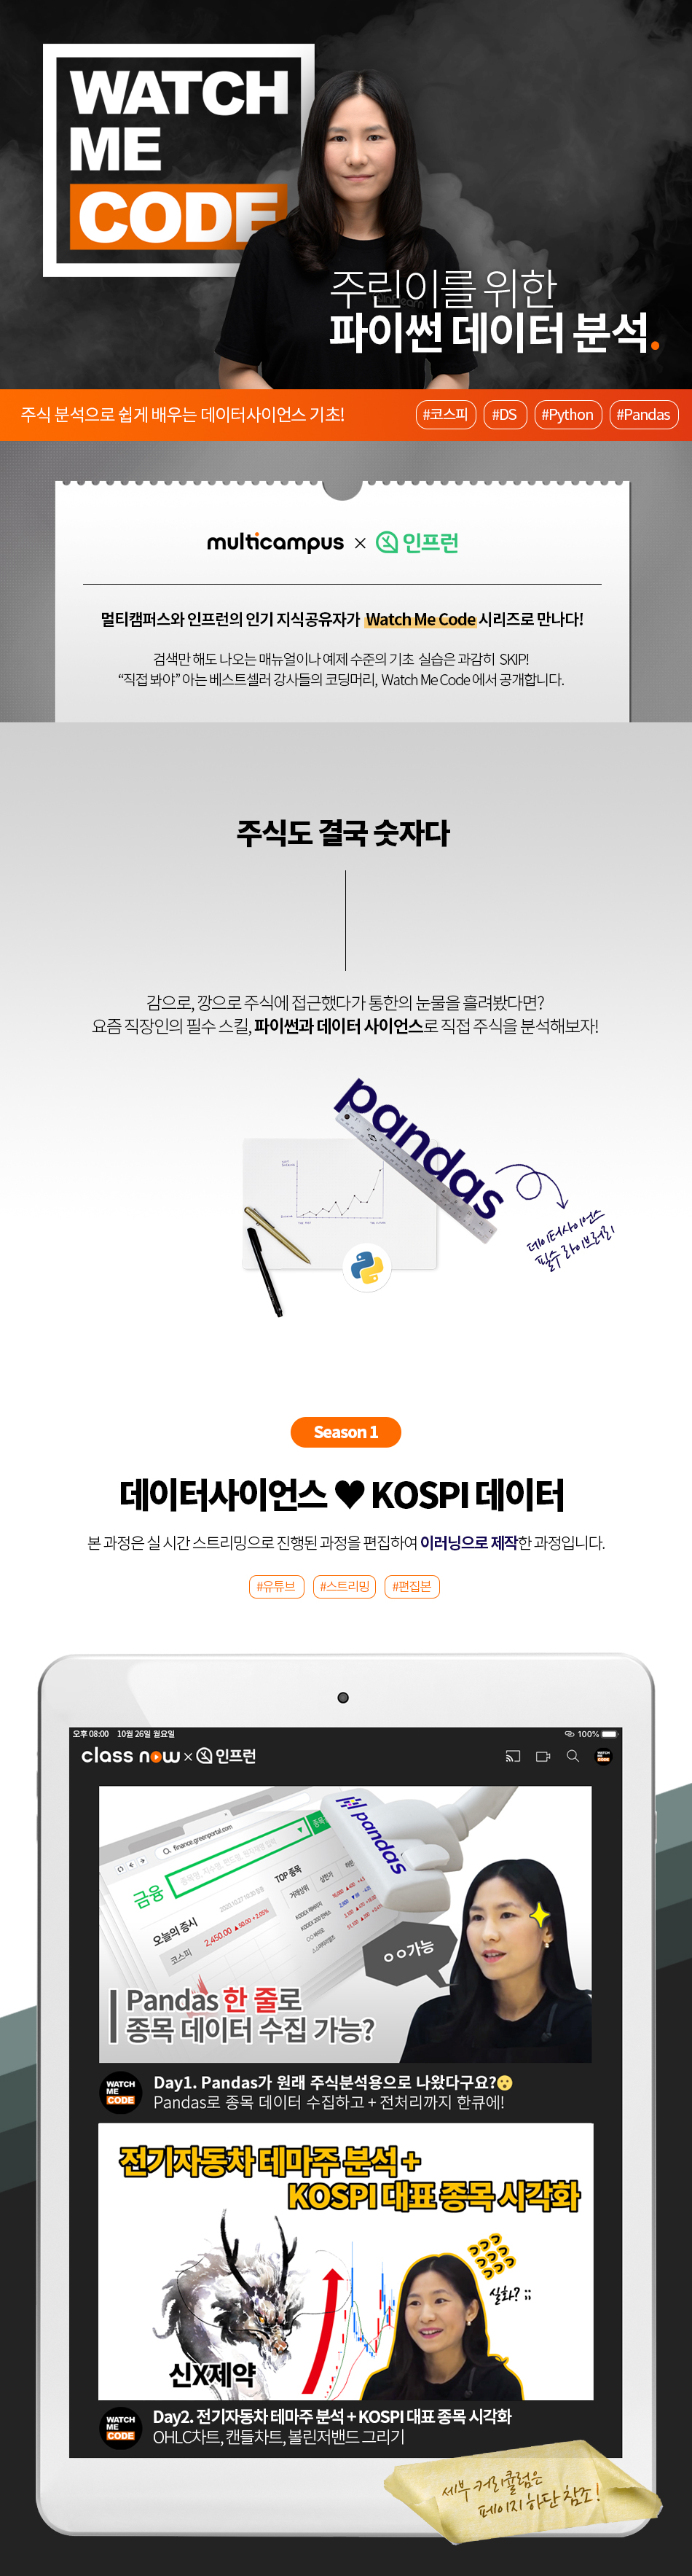
Pandas is one of the most widely used libraries in Python. Having established itself as an essential element for data analysis, you can learn everything about Pandas—the indispensable library for Python data analysis—through the <Pandas in One Shot> course.
초급
Pandas
![[Renewal] Python Data Analysis for Beginners (Easy! Master the entire process of preprocessing, pandas, and visualization) [Data Analysis/Science Part 1]강의 썸네일](https://cdn.inflearn.com/public/course-325576-cover/75d85753-8e0b-40f3-9f11-ca43e70c5200?f=avif&w=420)


![[Python in Practice] Web Crawling and Data Analysis: Analysis of the Transfer Fees of Football Players Worldwide강의 썸네일](https://cdn.inflearn.com/public/courses/326406/cover/150871bf-bc44-4a81-a577-c957f2df0a5f?f=avif&w=420)
![[Renewed] Python Machine Learning Bootcamp for Beginners (Easy! Learn by Solving Real Kaggle Problems) [Data Analysis/Science Part2]강의 썸네일](https://cdn.inflearn.com/public/courses/327464/cover/55c4db7b-7764-43cc-ac75-d9e8d08098f1/327464-eng.png?f=avif&w=420)


![[Renewal] First-time SQL and Database (MySQL) Bootcamp [From Beginner to Application]강의 썸네일](https://cdn.inflearn.com/public/courses/324208/cover/85872a8e-d2bb-4c43-82fc-d55fa067746e/324208.png?f=avif&w=420)


![[Side Project After Work] Big Data Analysis Certification Practical Exam (Type 1, 2, 3)강의 썸네일](https://cdn.inflearn.com/public/courses/329972/cover/dcfb28fd-48c1-4bb1-ab31-d59eac874194/329972-original.png?f=avif&w=420)