[Deep Learning Expert Course DL1111] Python for Data Visualization for Engineering Students
The ability to visualize data is essential for developers, researchers, and students alike. This course will teach you how to effectively visualize your data.
1. I haven't listened to it all yet, but it's a really, really, really good lecture.
2. It's a lecture that's hard to listen to elsewhere. Usually, there are only very introductory contents or recipes on the Internet, but this lecture properly teaches how to draw and configure graphs, and how the API is structured internally.
3. It would be nice if an engineering major could teach everything about pytorch and machine learning, etc.ㅋㅋㅋㅋㅋㅋ
5.0
SungHwan Kim
100% enrolled
I don't think there's any other lecture that explains matplotlib in such detail.
5.0
최광성
17% enrolled
This is a well-made course based on a lot of experience. I recommend it.
What you will gain after the course
Matplotlib
Python
Data Visualization
How to best convey diverse data, Draw the graph you want with data visualization .
No matter what research we conduct or what results we produce, the results are usually expressed in numbers. And the best way to communicate this is through visualization. There are graphs appropriate for each data characteristic, and the ability to create a variety of graphs is the best way to present the results you've worked so hard to produce.
This course covers how to appropriately visualize a variety of data, from the very basics through the creation of real-world papers and examples. Beyond simply using a simple API, the course delves into how to customize the detailed elements of a graph. This allows students to create any graph they desire, provided they have the data.
I am confident that not only the lectures but also the lecture materials will serve as excellent reference materials for you to use in future presentations or papers.
Characteristics
This course consists of seven chapters, with Chapter 1 being the most distinctive. In this chapter, you'll learn the fundamentals applicable to a wide range of Matplotlib graphs, establishing a solid foundation for visualization. It covers all the elements shown in the Matplotlib anatomy section on the official Matplotlib website, and you'll be able to apply them throughout the remaining chapters, providing a foundational understanding not found in other courses.
Chapters 2 through 7 cover how to draw a variety of graphs. Here's what you'll learn:
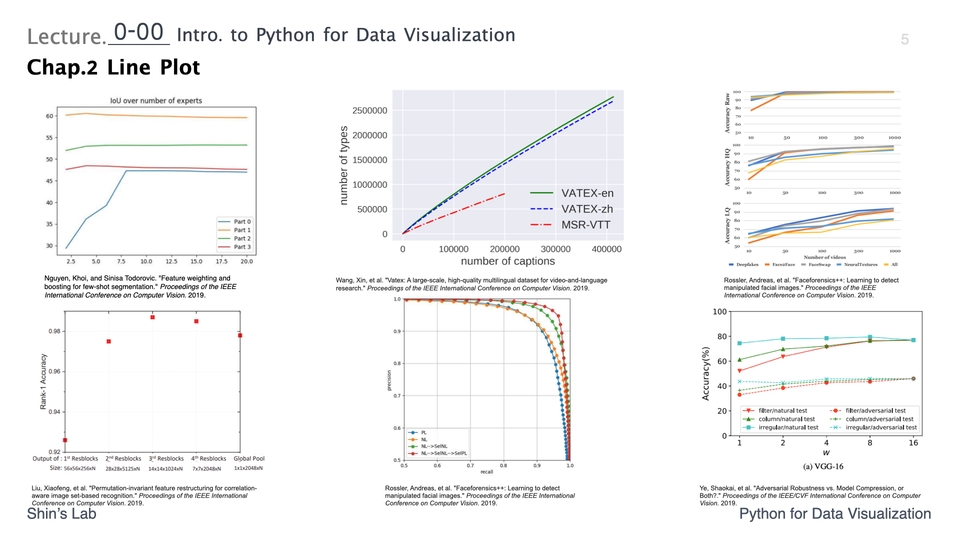
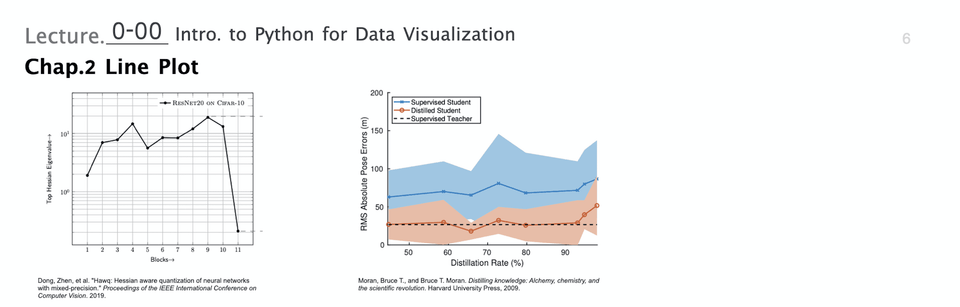
Chap.2 Line Plot
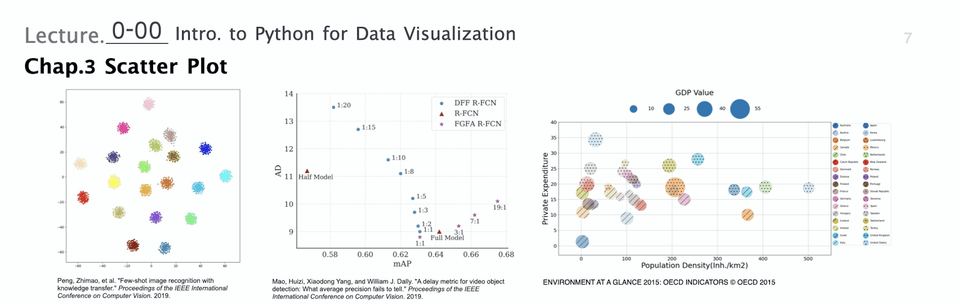
Chap.3 Scatter Plot
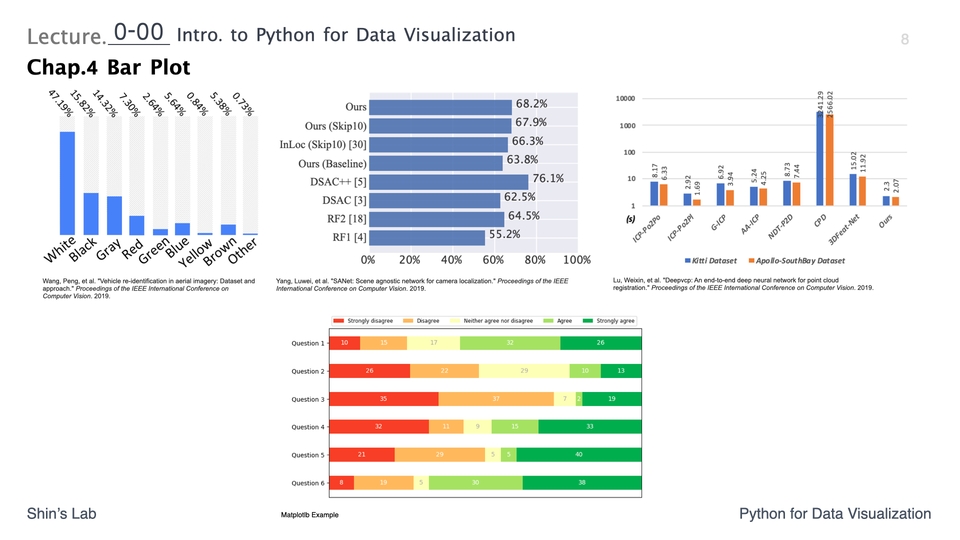
Chap.4 Bar Plot
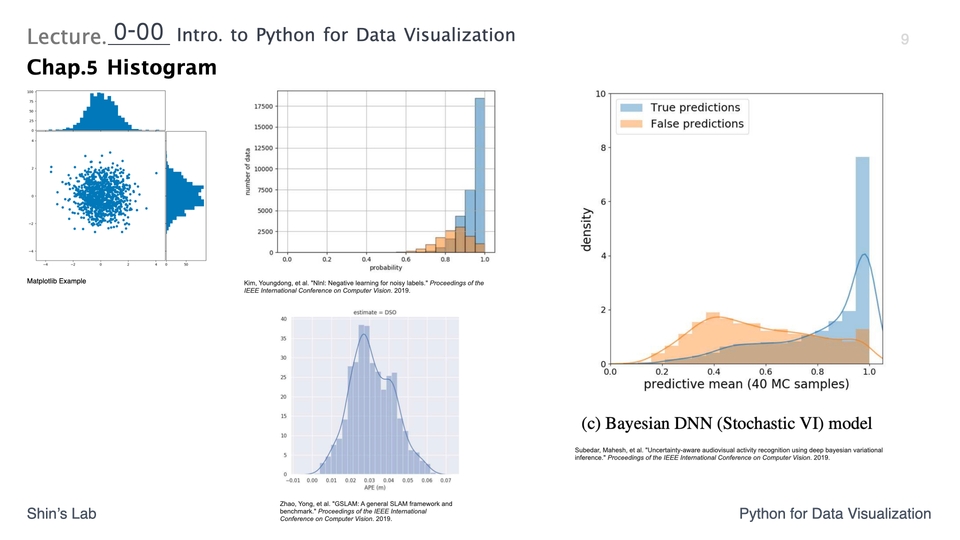
Chap.5 Histogram
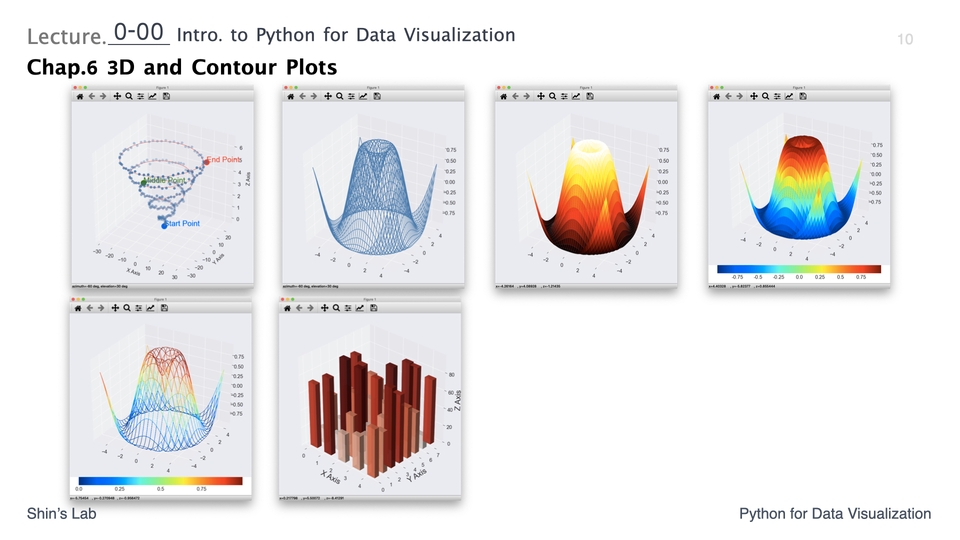
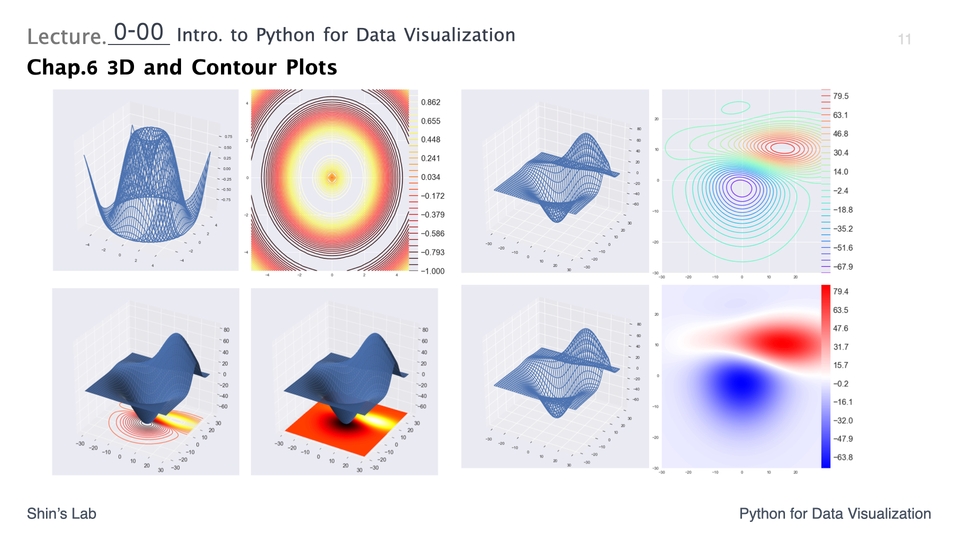
Chap.6 3D and Contour Plots
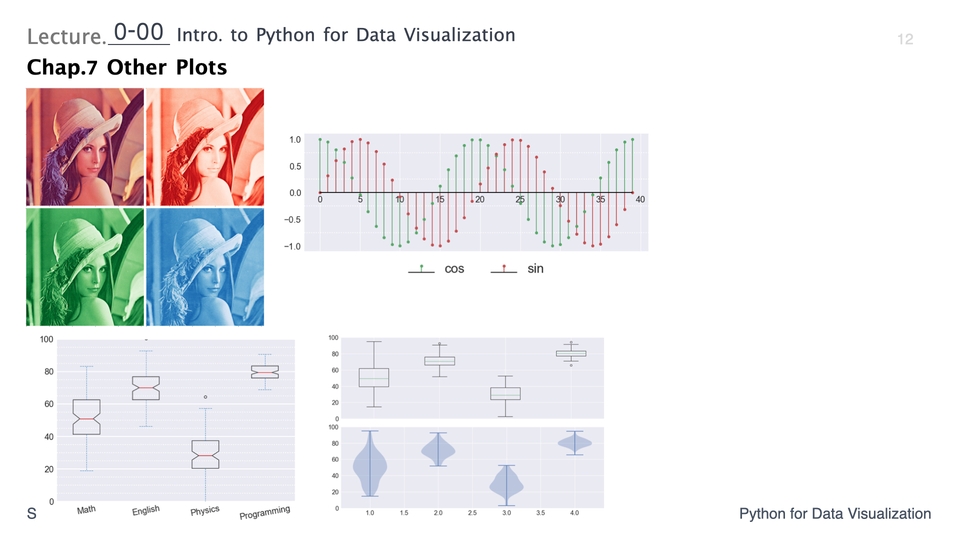
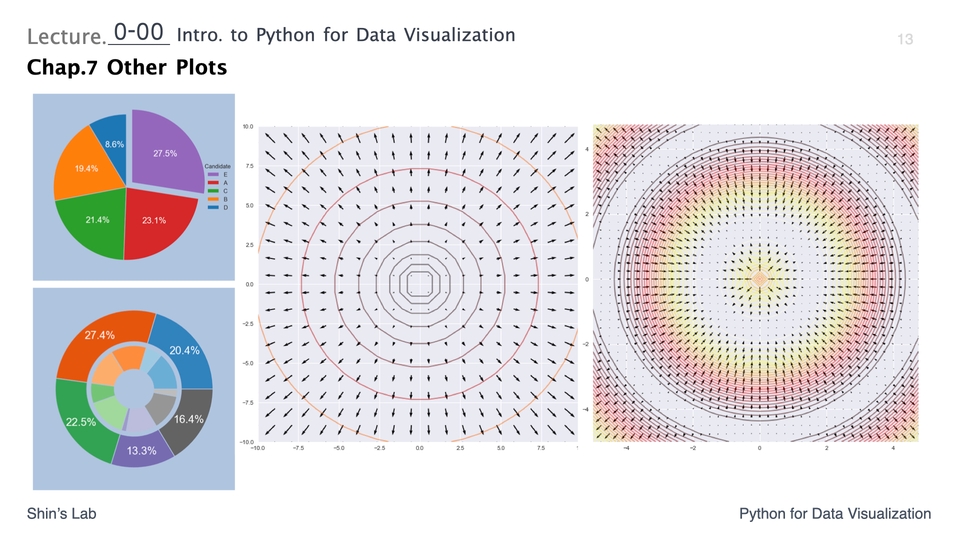
Chap.7 Other Plots
Imshow
Stem Plot
Box and Whisker Plot
Pie Plot
Vector Field
By mastering the above content, students will be able to handle most of the visualizations used in practice.
Visualization Examples
Here are some actual visualizations we create in class:
Recommended for these people
Who is this course right for?
Anyone who deals with Python
Researchers and Developers
For those who want high-level visualization
Hello This is
3,816
Learners
175
Reviews
85
Answers
4.9
Rating
20
Courses
Lecture History
[Like Lion] Intermediate/Advanced AI Course
[National Institute of Meteorological Sciences] 2022, 2023, 2025 Meteorological AI Boost Camp
[Samsung Electro-Mechanics] Advanced Software Course for New Employees
[Korea Institute of Human Resources Development in Science and Technology] Long-term Mentoring for Strengthening R&D Implementation Capabilities
[Korea Institute of Human Resources Development in Science and Technology] E-learning content production for R&D professional courses
[Korea Institute of Human Resources Development in Science and Technology] Research Data Visualization Course for Postdoctoral Researchers
[Wonkwang University] Wonkwang University AI Collective Training and AI Short/Long-term Courses
[National Information Society Agency] SW Education for Women Professionals
[SK m&service] Data-Driven Decision Making
[Korea IT Business Promotion Association] ICT COG Academy
[Seoul Metropolitan Office of Education] Training in New Technology Fields
[KT] KT AI Competency Enhancement Course
[K-ICT] Data Safe Zone Analysis Camp
[Gyeonggi-do Business & Science Accelerator] Vision AI for Beginners
[Gyeonggi Business & Science Accelerator] Introduction to Data Analysis with Python
[Seoul National University of Science and Technology] Advanced AI Utilization Training
[Seoul National University] AI Utilization Capacity Building Training
[HD Korea Shipbuilding & Offshore Engineering] AIC AI Research Position Competency Assessment Development
[Multicampus] Mastering Core Machine Learning Algorithms: From Principles to Implementation
[Fast Campus] A Mathematical Approach to Deep Learning
[패스트캠퍼스] Machine Learning and Data Analysis A-Z: All-in-One Master Class
[Fast Campus] Byte Degree Lv.2 Deep Learning Essentials
[Fast Campus] Deep Learning & AI Super Gap
[Fast Campus] Computer Science Super Gap VER.2
Analysis A-Z [Fast Campus] Byte Degree Lv.2 Deep Learning Essentials [Fast Campus] Deep Learning AI Super Gap [Fast Campus] Computer Science Super Gap VER.2
1. I haven't listened to it all yet, but it's a really, really, really good lecture.
2. It's a lecture that's hard to listen to elsewhere. Usually, there are only very introductory contents or recipes on the Internet, but this lecture properly teaches how to draw and configure graphs, and how the API is structured internally.
3. It would be nice if an engineering major could teach everything about pytorch and machine learning, etc.ㅋㅋㅋㅋㅋㅋ
I'm taking this course after the pre- and post-course review! It's the best lecture I trust and listen to! I think I can finish matplotlib with this lecture.


![[PY 0205] Python Level 4 for Artificial Intelligence - Objects and Classes강의 썸네일](https://cdn.inflearn.com/public/courses/334425/cover/d595b571-3e0c-4a63-9d5f-f2195736de2b/334425.png?f=avif&w=420)


![[PL 0301] Python Virtual Environment and Anaconda강의 썸네일](https://cdn.inflearn.com/public/courses/334755/cover/9d8ca8fb-2031-4dba-aa31-efb43963dba7/334755.png?f=avif&w=420)
![[PY 0203] Debugging Fundamentals강의 썸네일](https://cdn.inflearn.com/public/courses/333278/cover/1c14834a-9ab7-4973-b8f0-e8f6f24bffc8/333278.png?f=avif&w=420)
![[PL 0302] Python for Data Manipulation - NumPy Masterclass강의 썸네일](https://cdn.inflearn.com/public/courses/334756/cover/a4cbdc80-53da-4422-9b8d-67362b68a9fa/334756.png?f=avif&w=420)

![[PL 0303] Python for Data Visualization - Matplotlib Master Class강의 썸네일](https://cdn.inflearn.com/public/courses/336172/cover/80fa86e7-dcb6-4b0f-b15b-323b6fa32809/336172.png?f=avif&w=420)
![[PY 0202] Python Level 2 for Artificial Intelligence강의 썸네일](https://cdn.inflearn.com/public/courses/332825/cover/af1a2083-d1ee-4b72-8ce9-55281cb89c9a/332825.png?f=avif&w=420)
![[PY 0201] Python Level 1 for Artificial Intelligence강의 썸네일](https://cdn.inflearn.com/public/courses/332643/cover/db98c954-be00-44ca-bd33-3cd69e290fff/Untitled.001.png?f=avif&w=420)
![[PY 0204] Python Level 3 for Artificial Intelligence - Functions강의 썸네일](https://cdn.inflearn.com/public/courses/333279/cover/eb80d90b-0359-4c7d-b9ee-f4997c35171d/333279.png?f=avif&w=420)

