


Free humanity from mathematics (Linear Algebra Part.I) - Vector Geometry
asdfghjkl13551941
This is the first lecture in linear algebra, and it is a lecture that geometrically understands vectors and vector operations.
入門
Linear Algebra, algebra

How to best convey diverse data,
Draw the graph you want with data visualization .
No matter what research we conduct or what results we produce, the results are usually expressed in numbers. And the best way to communicate this is through visualization. There are graphs appropriate for each data characteristic, and the ability to create a variety of graphs is the best way to present the results you've worked so hard to produce.
This course covers how to appropriately visualize a variety of data, from the very basics through the creation of real-world papers and examples. Beyond simply using a simple API, the course delves into how to customize the detailed elements of a graph. This allows students to create any graph they desire, provided they have the data.
I am confident that not only the lectures but also the lecture materials will serve as excellent reference materials for you to use in future presentations or papers.

This course consists of seven chapters, with Chapter 1 being the most distinctive. In this chapter, you'll learn the fundamentals applicable to a wide range of Matplotlib graphs, establishing a solid foundation for visualization. It covers all the elements shown in the Matplotlib anatomy section on the official Matplotlib website, and you'll be able to apply them throughout the remaining chapters, providing a foundational understanding not found in other courses.
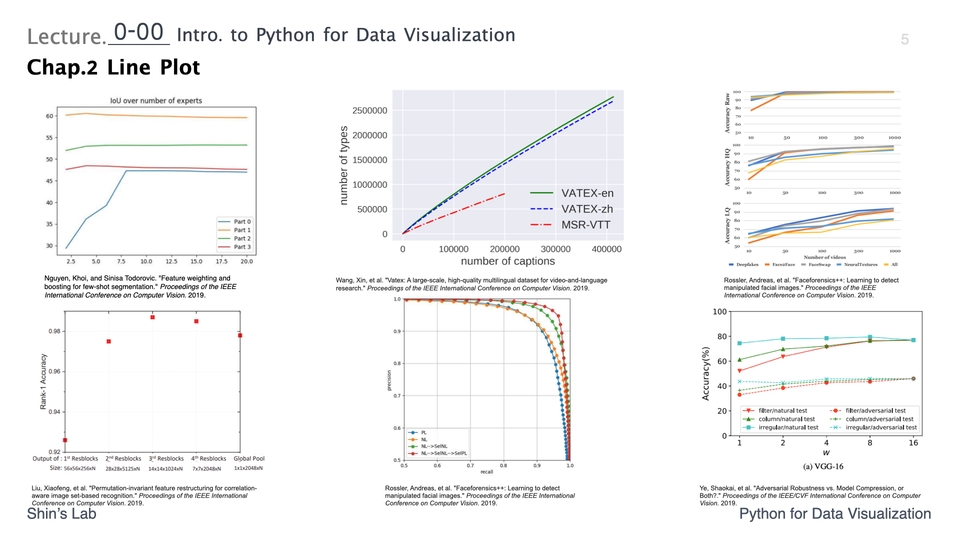
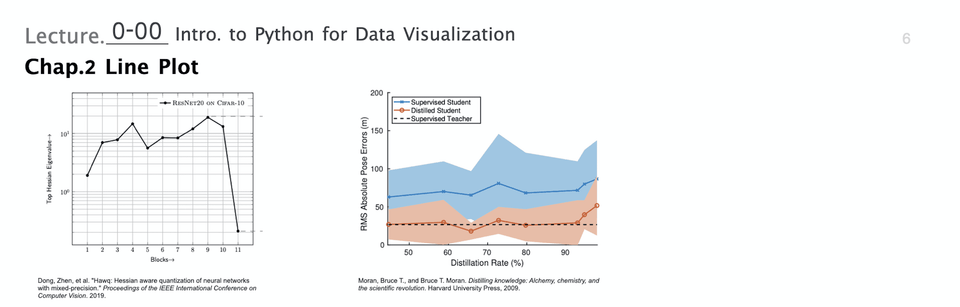
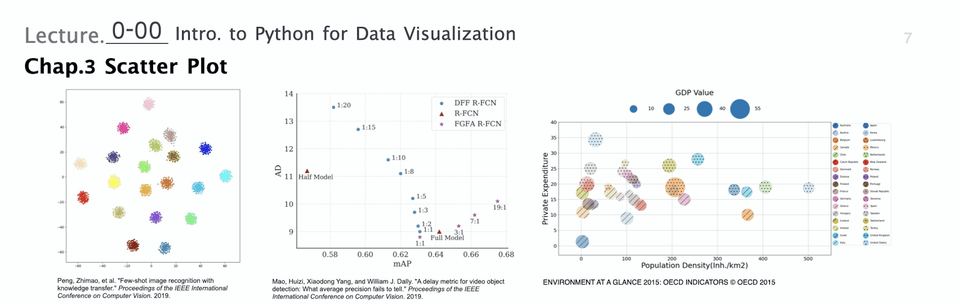
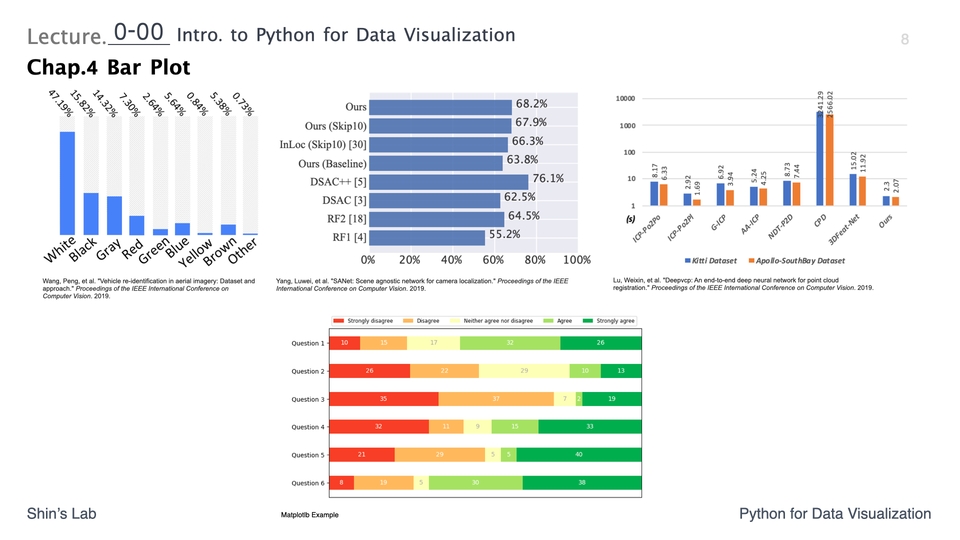
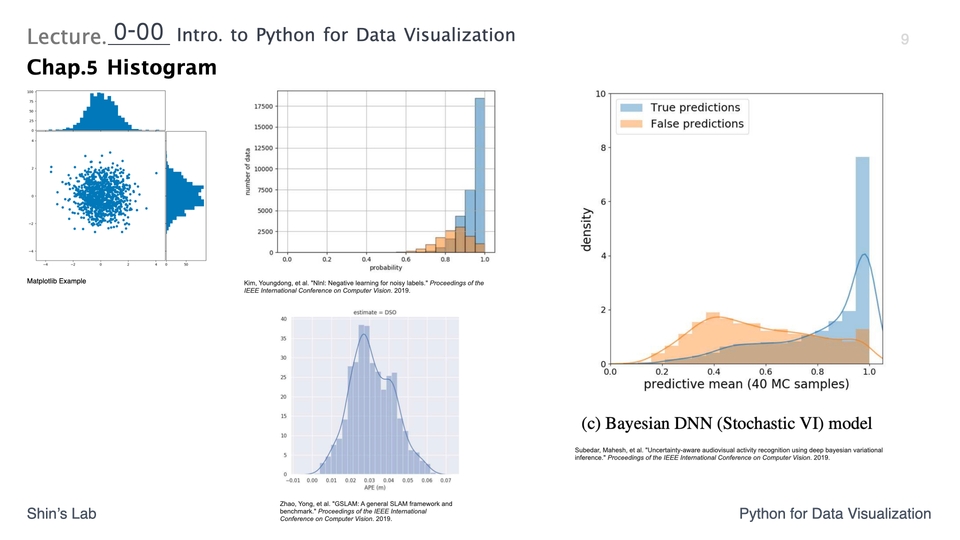
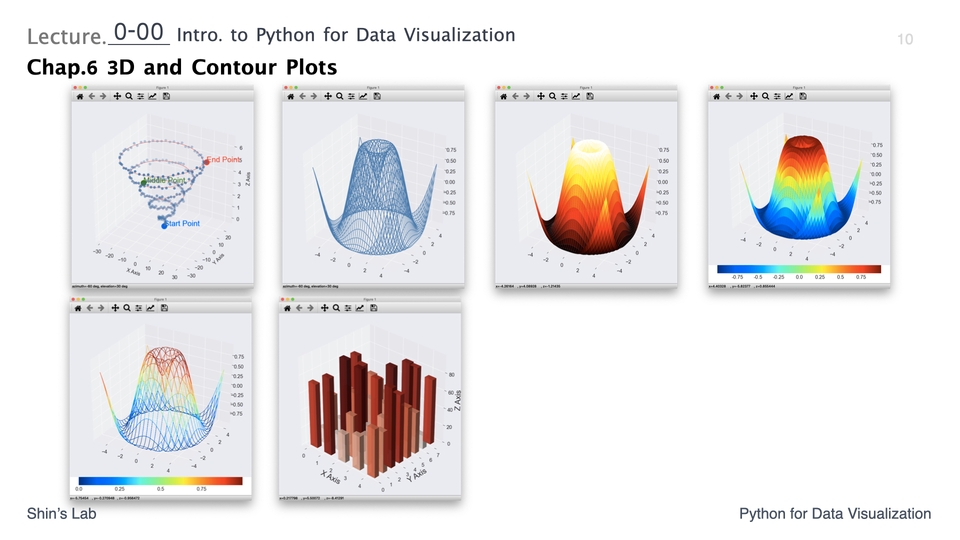
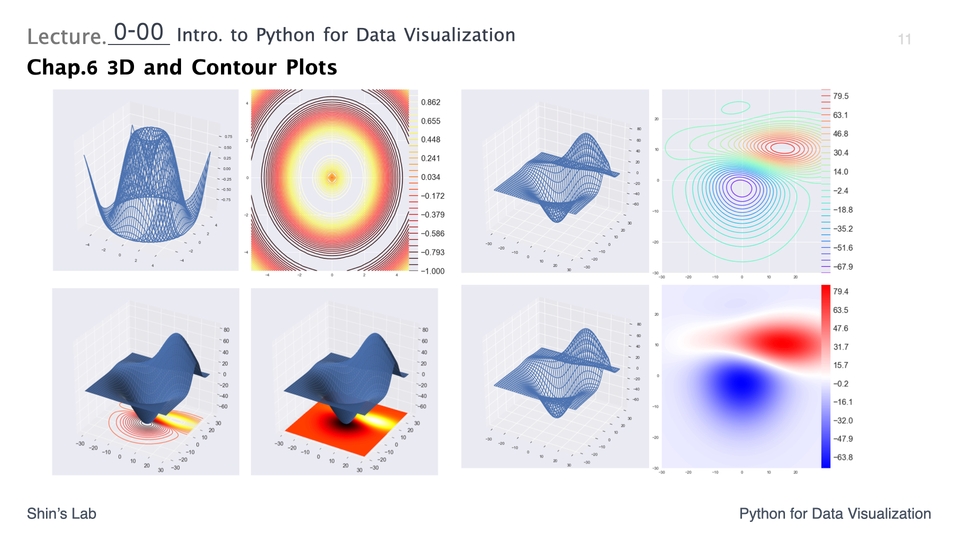
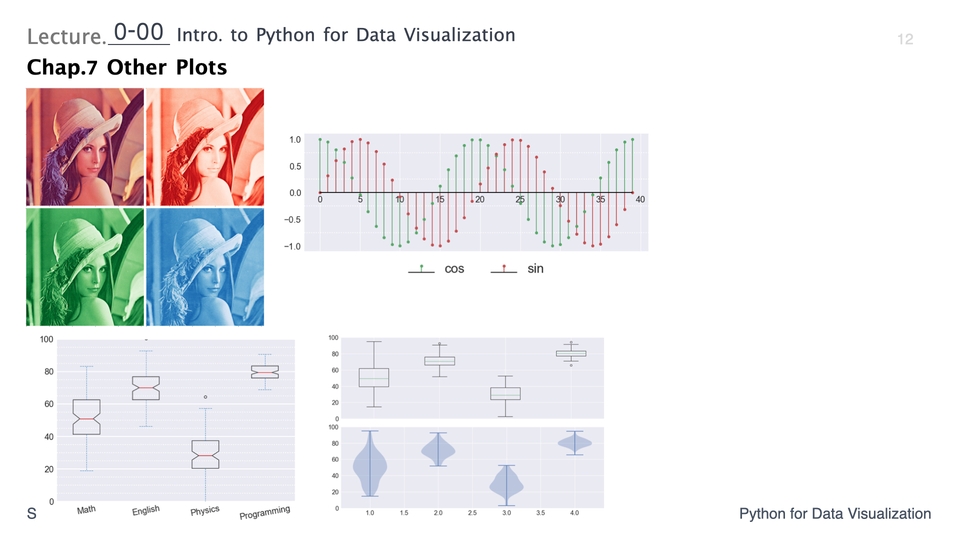
Chapters 2 through 7 cover how to draw a variety of graphs. Here's what you'll learn:
By mastering the above content, students will be able to handle most of the visualizations used in practice.
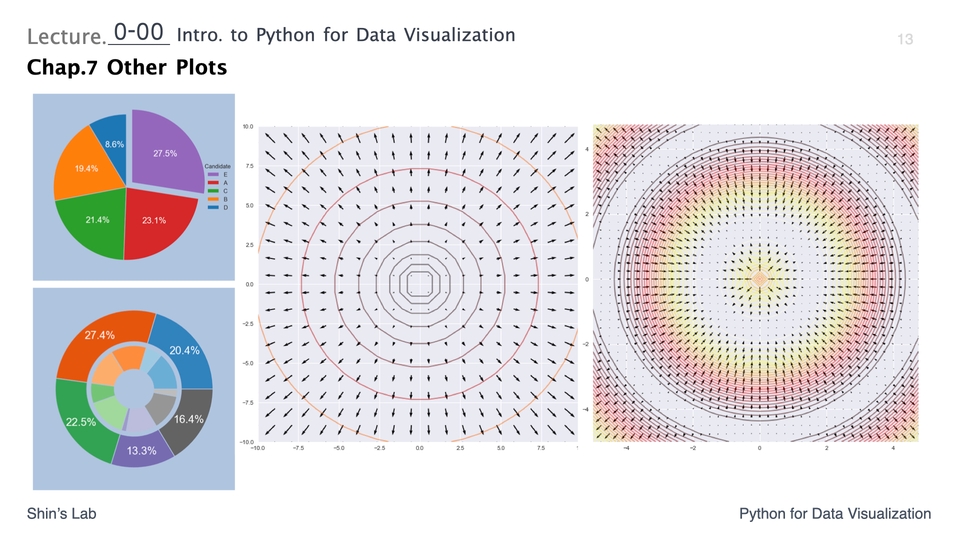
Here are some actual visualizations we create in class:
I don't think there's any other lecture that explains matplotlib in such detail.
Thank you for the great lecture!!! It's so so so so so so helpful ㅎㅎ
This is a well-made course based on a lot of experience. I recommend it.
1. I haven't listened to it all yet, but it's a really, really, really good lecture. 2. It's a lecture that's hard to listen to elsewhere. Usually, there are only very introductory contents or recipes on the Internet, but this lecture properly teaches how to draw and configure graphs, and how the API is structured internally. 3. It would be nice if an engineering major could teach everything about pytorch and machine learning, etc.ㅋㅋㅋㅋㅋㅋ
I'm taking this course after the pre- and post-course review! It's the best lecture I trust and listen to! I think I can finish matplotlib with this lecture.
![[PL 0302] Python for Data Manipulation - NumPy Masterclass講義サムネイル](https://cdn.inflearn.com/public/courses/334756/cover/a4cbdc80-53da-4422-9b8d-67362b68a9fa/334756.png?f=avif&w=420)


![[PY 0205] Python Level 4 for Artificial Intelligence - Objects and Classes講義サムネイル](https://cdn.inflearn.com/public/courses/334425/cover/d595b571-3e0c-4a63-9d5f-f2195736de2b/334425.png?f=avif&w=420)
![[PY 0204] Python Level 3 for Artificial Intelligence - Functions講義サムネイル](https://cdn.inflearn.com/public/courses/333279/cover/eb80d90b-0359-4c7d-b9ee-f4997c35171d/333279.png?f=avif&w=420)
![[PY 0203] Debugging Fundamentals講義サムネイル](https://cdn.inflearn.com/public/courses/333278/cover/1c14834a-9ab7-4973-b8f0-e8f6f24bffc8/333278.png?f=avif&w=420)
![[PY 0202] Python Level 2 for Artificial Intelligence講義サムネイル](https://cdn.inflearn.com/public/courses/332825/cover/af1a2083-d1ee-4b72-8ce9-55281cb89c9a/332825.png?f=avif&w=420)

![[PL 0301] Python Virtual Environment and Anaconda講義サムネイル](https://cdn.inflearn.com/public/courses/334755/cover/9d8ca8fb-2031-4dba-aa31-efb43963dba7/334755.png?f=avif&w=420)


![[PL 0303] Python for Data Visualization - Matplotlib Master Class講義サムネイル](https://cdn.inflearn.com/public/courses/336172/cover/80fa86e7-dcb6-4b0f-b15b-323b6fa32809/336172.png?f=avif&w=420)