Advanced Modern Javascript with ES6 Grammar Part 2
usefulit
$52.80
Intermediate / JavaScript, ES6
4.8
(30)
41,700+
This course is designed to learn the JavaScript programming language along with the latest ES6 grammar.
Intermediate
JavaScript, ES6
How long will you keep learning only to rotate boxes or spheres? You need to see the forest, not just the trees; if you only see the trees, your thinking won't grow. Escape being a complete beginner and experience the power of Three.js, which can be applied in practice and plays a role in the recently gaining attention field of digital twins. This is at a level applicable to work, not just for simple website spinning. Having the capability to create related models (glb, glTF...) in fields like manufacturing, defense, disaster management, and transportation will upgrade your domain expertise by another level. We also develop Node.js (Express) & Nest.js servers for On-Premises use on personal and company servers. Even with slight modifications to this course, you will be reborn as an IT talent along with creating powerful services. Don't be intimidated, challenge yourselves. It's not that difficult.^^
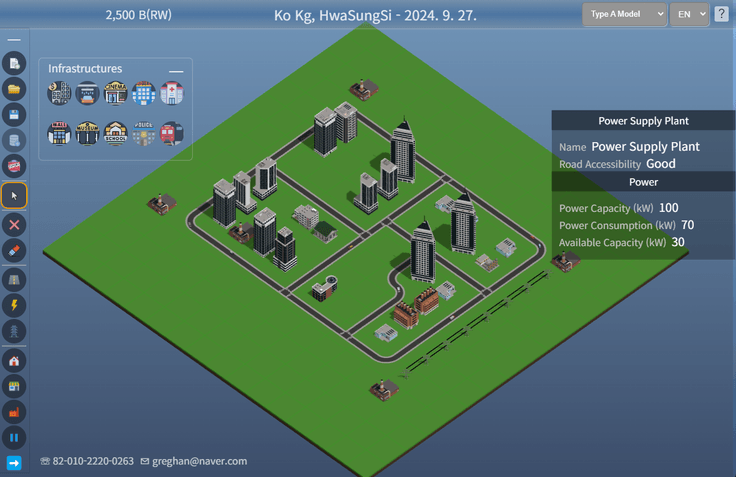
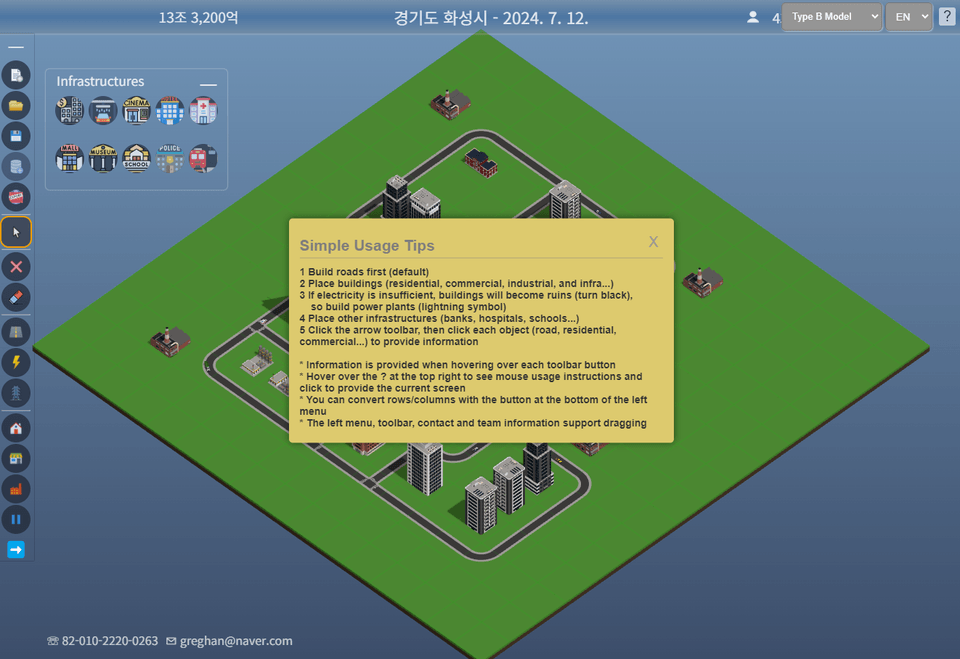
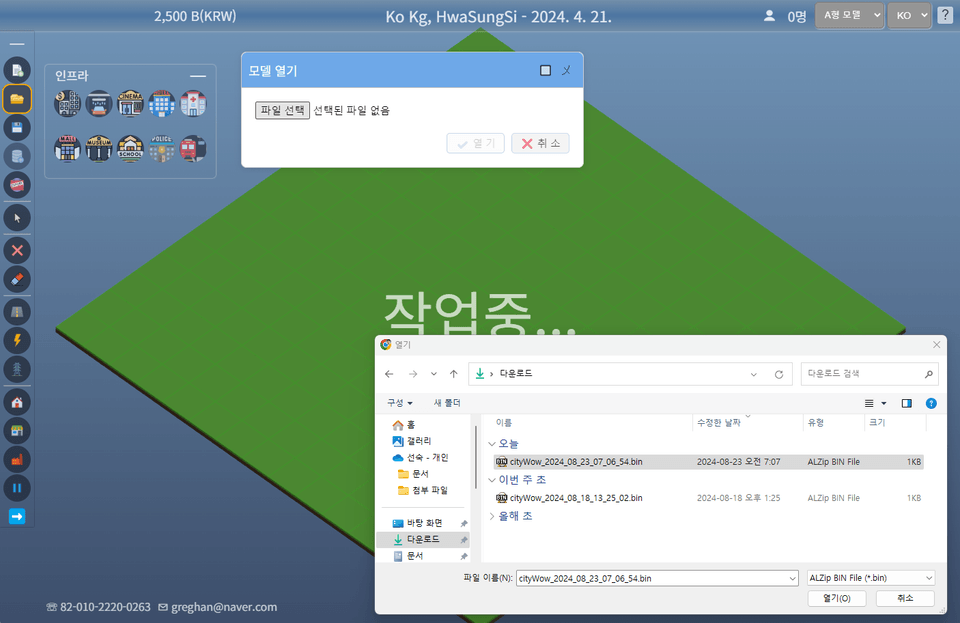
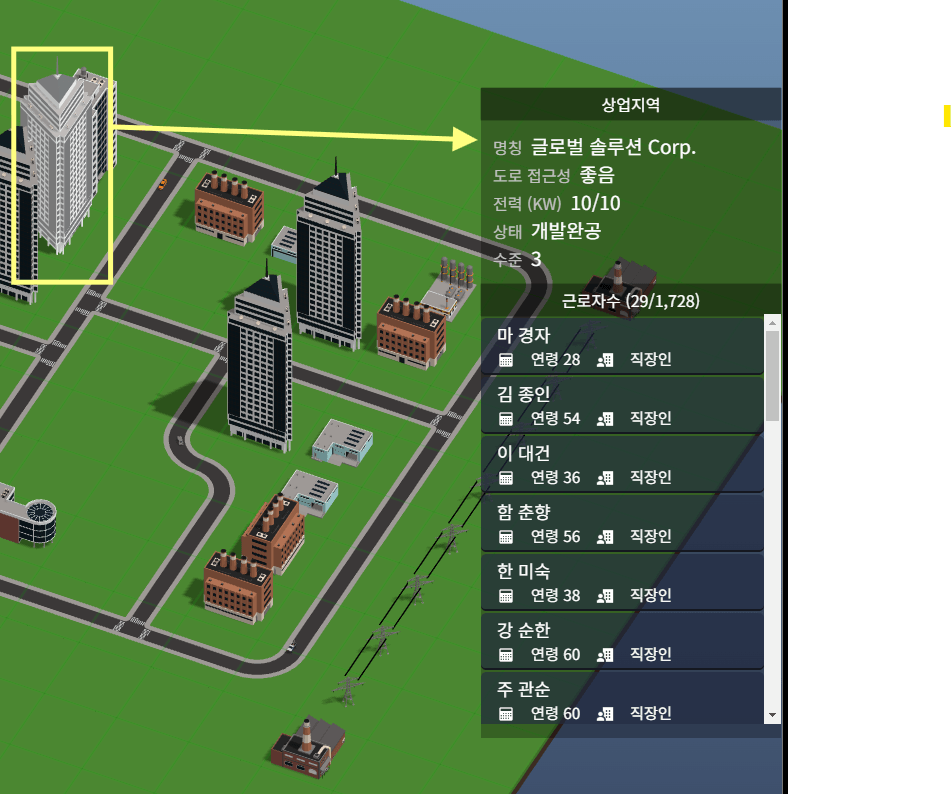
Create, save, and open a city using Three.js. Saving is in binary format. (Size: hundreds of Bytes ~ 2KB level, Readability: impossible)
Multilingual support (Korean, English, Japanese, etc.) is also developed with vanilla JavaScript and can be used in other web projects. (Complies with web standards)
After development, try creating a build using Vite and a CSS compression script with Gulp, which automatically replaces the compressed min.css in the built index.html. Also, when applied to package.json, the build and Netlify deployment are completed all at once.
Development complete and built. After Git commit and Netlify publishing, my own site is complete. Automatic deployment is applied when modified or enhanced.
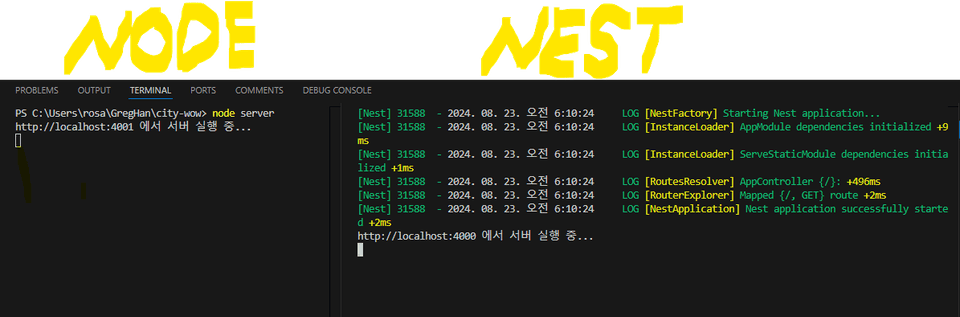
Develop my own simple Node server and a trendy Nest server to run the results On-Premises.
Finally, we will explain CSS entirely and optimize the code developed so far.

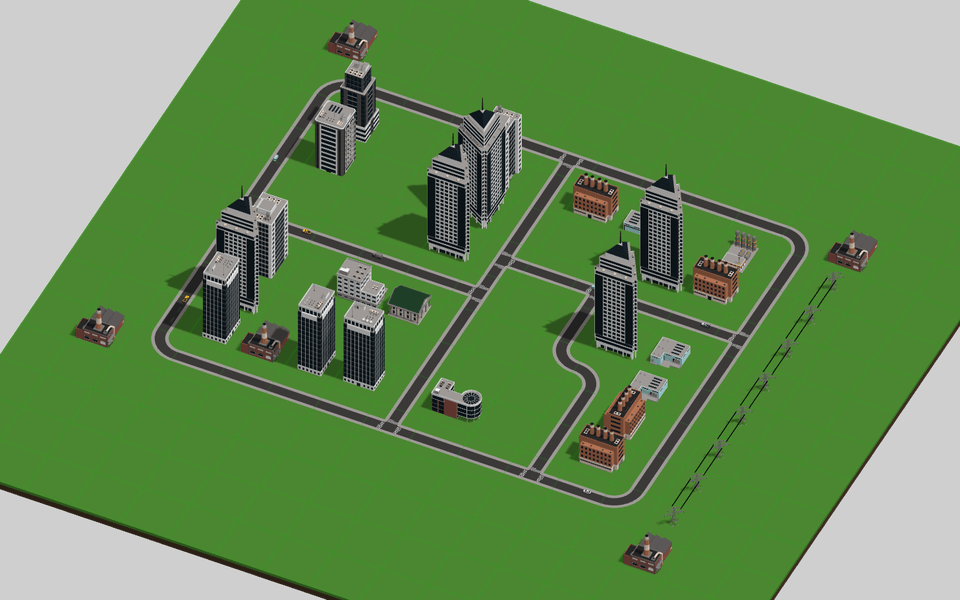
The answer lies in Three.js . Three.js is the technology that implements digital twins, VR, and many other fields, including city models, manufacturing process models, and disaster models .
In this lecture, we will mostly use Three.js. You will create a 3D service, integrate it with Git, and automatically deploy it to Netlify , and have your own site for free. Of course, if you have a domain, just connect it.
For running on personal and corporate servers. We develop two servers: a Node.js server and a Nest.js server .
If you need multilingual service , try to write your own multilingual module by creating it together rather than injecting a heavy library. It can be applied to all web projects (web-standard compliance) . ( Coding in multiple languages from Section 4 )
Rather than spending time just on basic grammar and follow-through examples, learn backwards from the complete thing. Then modify, improve, and apply it to something that interests you.
Don't just let the instructor code, code it yourself, then it becomes yours and you will improve .

Anyone who only creates objects with Three.js but is curious about what happens after that?
2/3D are both good, but where and how should I use them? Most of the time, I rotate BoxGeometry, so where can I use them?
Three.js beginner / IT employee

How to save/open Three.js?
How do I toJSON() a new THREE.Scene() object? How do I open and display it afterwards? The size is huge (tens to hundreds of M/GB), otherwise I get a Maximum call error 😰
Three.js Developer / IT Representative

Are you curious about the web from beginning to end?
If Three.js is better, and if not, is there a simple full-stack? What is Node.js and what is Nest.js? Is it easy to implement or understand? Is it possible to implement the web only with ThreeJS? Anyone who is curious
Web-front developer / IT assistant
Who is this course right for?
Rather than just doing Three.js and JS basics, those who want to learn, apply, and develop based on source code directly applicable to real-world projects.
3D is applicable to all fields, and an engineer who wants to differentiate in visualization fields such as the recently trending Metabus, Digital Twin, AR, VR, ML, DL, etc.
Those feeling typical FE tools make differentiation hard anymore.
Need to know before starting?
A foundation in JS, Three.js is beneficial. If you don't have one, it will be challenging, but not impossible. There is also a methodology involving reverse engineering, where you interpret and understand high-quality finished modules by working backward.
Having spent a long time adapting to technological changes, I now want to offer my skills and experience—however modest they may be—to beginners and intermediate developers to help them grow quickly.
DB Modeling, C/S & Web Full-Stack Developer
Website http://casual-insight.com
YouTube https://www.youtube.com/channel/UCBiU3IgXYAQHK1tUMXq3isQ
-.Mono-Repo (Turbo: "^2.3.4"), FCM(Firebase Cloud Message), WebHook, Redis, MQTT
-. Next & React ecosystem UI such as MUI-X, Material-UI, etc.
-.OCR(Naver), RIMS, Popbill, SNS Login(Google,Naver,Kakao)
-.Js, Vue/Nuxt (VueX, Pinia), AngularJS, React/Next (Redux, Zustand, Recoil), Svelte,
D3, Three (WebGL), C2i: BI charts supplied to the Blue House, echarts, Vuetify, Quasar, Telerik (Progress)
IndexedDB & SqlLite, css, scss, sass, Tailwind, Bootstrap...
-.Leaflet.js, Cesium.js, Daum & Naver Maps
-.WebRTC & WebSocket, MQTT, Silverlight(C#) & ASP.Net
-.Node, Nest, Spring Boot, Docker, Git, pm2
-.AWS, Azure, nCloud(Naver)
-.Oracle, PostgreSQL, MySQL, MariaDB, MS-SQL, MongoDB(mongoose), InfluxDB, Supabase
-.Python, Numpy/Scipy, Jupyter, Django(DRF: Django Rest Framework)/Flask,
-.TensorFlow, Keras, ScikitRun, LangChain
-.City-Wow: 3D simulation for land, national defense, public sectors, hospitals, manufacturing companies, etc., and
Real-time monitoring service ('23.10 ~ Present; Three, Vanila.js)
-.SeeU: Video chat services by industry (Hospital, Manufacturing, etc.) (Google Meet + Chromakey, STT & TTS Chatting)
('23.02 ~ 23.10; WebRTC, WebSocket, Vue3 & Pinia, Quasar, Node, MySQL)
-.Survey-Wow: Simply analyze survey results from Google Forms, MS Forms, and Naver Forms and
Shared Data Analysis Web Service ('22.03 ~ 23.01; Vue2 & VueX, Quasar, Node, MySQL)
-.Data-Wow: Automatic analysis and visualization of public data, including xls, json, csv, and API integration
('22.01 ~ 22.12; Vue2 & VueX, Vuetify, Node, MongoDB) - Ministry of the Interior and Safety Public Data Award
-.DDMV(Data-Dam Multi-Dimensional Vis-): Data-Dam multi-dimensional exploratory visualization analysis service
('20.01 ~ 20.08; Vue2 & VueX, Vuetify, Node, MongoDB) - Incheon City Public Data Award
-.C2i (Chart Intelligence Insights) Chart Component: Chart Gallery Menu
BI-based Charts (with D3.js): Apr '15 ~ Present; BI pattern chart solution based on D3.js (v3.3 ~ v7.9)
(Delivered the Job Dashboard to the Blue House under the Moon Jae-in administration, and delivered a national financial management project to Mongolia. Multi-language support)
-.Casual-Insights Co., Ltd. CTO
-.Former KISTI Researcher
-.Former LG-CNS Oracle Modeler, DBA & Senior Researcher
-.Former Employee, IT Department, Kukdong (Hyundai) Oil Refinery
**. Data Dam Multidimensional Visualization - General Introduction (Required): https://youtu.be/noZ9H7wftsI
-.Consumer Commercial Area-I (Required: Department store POS data - general manufacturing/retailers): https://youtu.be/ArL-Pv3U-40 -.Consumer/Commercial Area-II (Data provided by Korea KDX, Siksin): https://youtu.be/Wcpu29gI53Y
-.Health & Medical (Provided by Korea KDX, Onnuri H&C data): https://youtu.be/I8WBqAFp9L4-
.Public Data (Provided by Gyeonggi Hwaseong City Hall Public Data): https://youtu.be/2QCw_6aeRVE
*.D3 & ThreeJS Chart Gallery :https://gregory-han.github.io/chart/
All
35 lectures ∙ (17hr 32min)
Course Materials:
All
2 reviews
Explore other courses in the same field!
25% off for new members
$32.90
25%
$42.90