





inflearn logo

AI-powered UX data analysis for designers and PMs

If you're wondering, "I did the user research... but is this result truly representative of all users?" then pay attention! We will show you exactly how to add persuasiveness to your designs based on data. ✅ We explain complex statistical terms in very simple language. ✅ We carefully introduce the 3 core hypothesis tests essential for UX practice, covering everything from principles to hands-on practice. ✅ We show you how to easily analyze user data using AI—without costs or hallucinations.

(5.0) 3 reviews

64 learners

Level Basic

Course period Unlimited

Statistics
Statistics
Service Planning
Service Planning
UX Research
UX Research
DDD
DDD
data-analysis
data-analysis
Statistics
Statistics
Service Planning
Service Planning
UX Research
UX Research
DDD
DDD
data-analysis
data-analysis

What you will gain after the course

  • Ability to select data analysis methods that align with research objectives

  • How to validate design hypotheses based on data

  • Practical UX data analysis skills using AI


AI-powered UX Data Analysis for immediate practical use


I did conduct user research, but...
Is this result truly representative of all users?

Have you ever felt uncertain after conducting research because of these concerns?
Now, learn how to add persuasiveness to your designs based on data!


What you'll learn 🔍


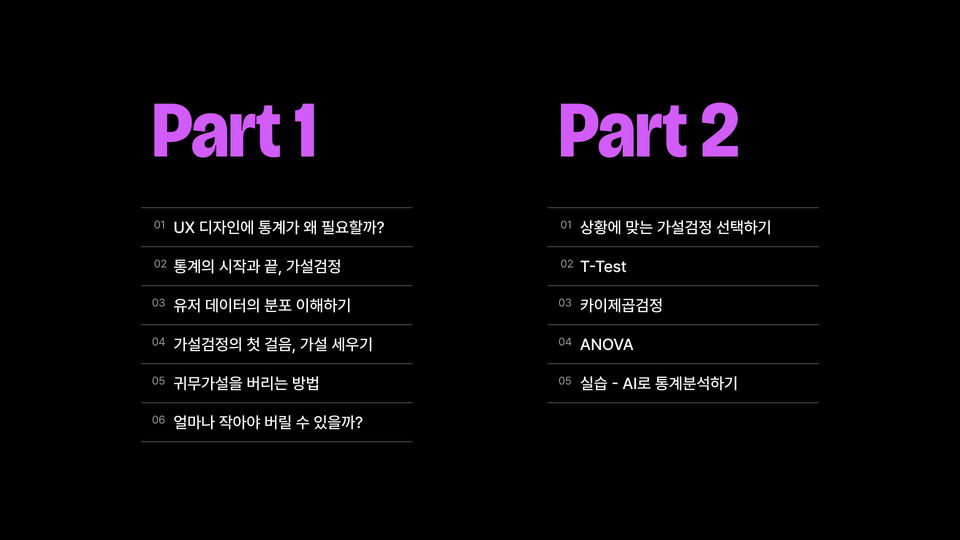
Section 1 - Essential UX Basic Statistics: Carefully Selected Core Concepts

We have carefully selected only the essential statistical concepts for UX design and will explain them to you in a simple and detailed manner.

You can understand 5 essential terms that have been confusing, such as P-value and significance level,
and build a solid foundation
in UX statistics.


Section 2 - Increasing Design Persuasiveness with Statistics

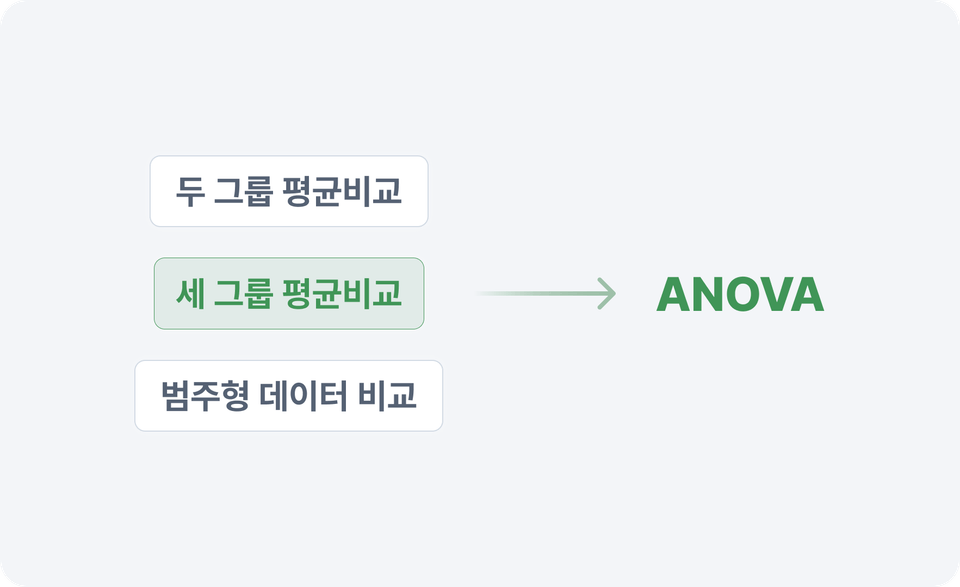
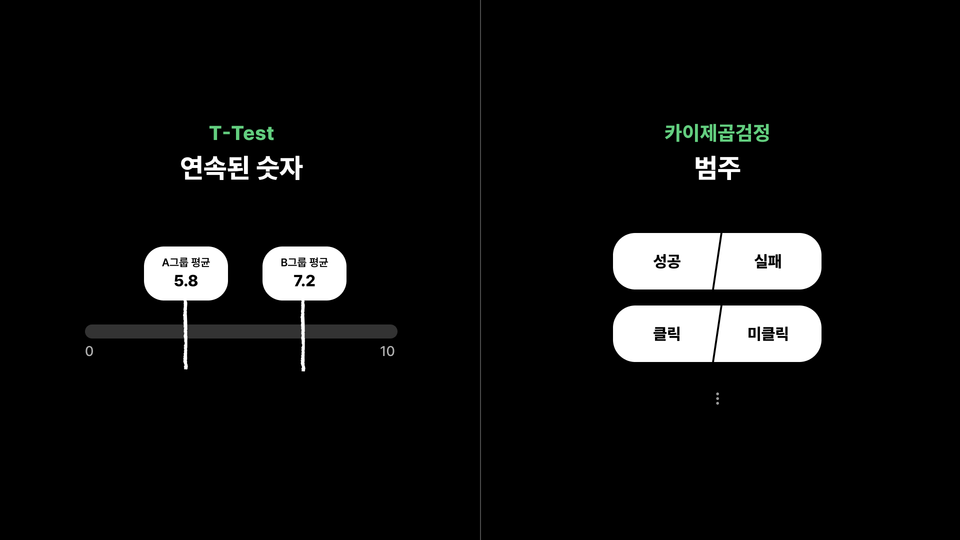
Even for the same A/B test, you should use the Chi-square test for click-through rates and the T-test for changes in dwell time?!

You can learn how to select research methods suitable for various situations and how to increase the persuasiveness of design decision-making through hypothesis testing, which is most frequently used in actual UX research.


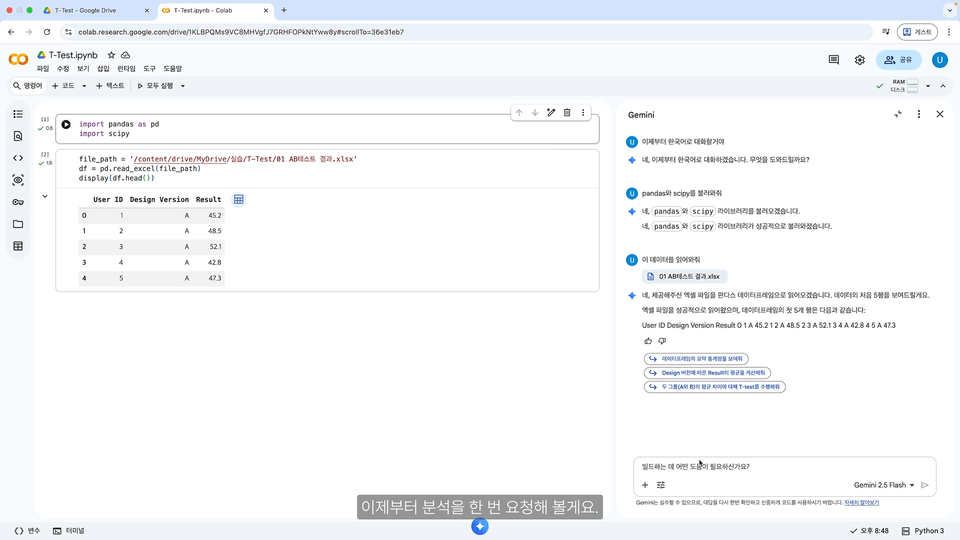
Section 3 - AI-Based Practical UX Data Analysis

If you've been wondering how to perform accurate data analysis using AI without hallucinations, pay attention!

We teach you everything from the format of organizing research results to how to perform T-Tests, ANOVA, and Chi-square tests quickly and efficiently using AI.


4 key points packed exclusively into this lecture!


Point 1. Easy and friendly visual materials

Statistical terms that are hard to understand no matter how many times you hear them.
To ensure you never get confused again,
I have painstakingly prepared visualized materials
that break down the concepts into small pieces.

✅ Visual materials provided upon course purchase!


Point 2. Complete the course in just 1.5 hours, or 3 days of commuting!

The time needed to complete the course is only 1.5 hours!
Invest just 30 minutes of your commute for 3 days
to master UX statistics.
We've prepared it compactly.


Point 3. A lecture strictly for PMs and designers

There are many lectures that teach statistical analysis,
but it was hard to find a statistical analysis lecture specifically for UX, wasn't it?
We have selected and will teach you only the core essentials
necessary for UX design.


Point 4. AI data analysis know-how without hallucinations

Were you worried because AI analyzes arbitrarily and statistical tools like SPSS are
expensive and unfriendly?
We will show you how to analyze data accurately
using AI without hallucinations.


Created for people like this


✔️ UX/UI designers who want to practice data-driven design

  • Those who want to add persuasiveness to design decision-making based on data

  • Those who want to easily understand only the core concepts of difficult statistics needed for UX design


✔️ PMs/POs who want to properly understand user data for service improvement

  • Those who want to enhance product planning based on quantitative evidence

  • Those who want to establish and verify data-driven hypotheses for service improvement


✔️ Anyone interested in UX data analysis

  • Those who have been curious about statistical terms used in product data analysis and hypothesis testing, such as p-value and null hypothesis.


  • Those who want to gain reliable AI-based UX data analysis know-how without hallucinations


Notes before taking the course

  • Hands-on Environment: AI-based practice sessions will be conducted in a web environment without the need for additional program installation.

  • Learning Materials: Example data required for the practice session will be provided.


Recommended for
these people

Who is this course right for?

  • UX/UI designers who want to validate design decisions with data

  • PMs/POs who want to advance product planning with quantitative evidence

  • Practitioners who want to quickly finish UX data analysis using AI

Need to know before starting?

  • Anyone can do it as long as they are interested in UX data analysis! 👀

Hello
This is commdelab

Career Verified

64

Learners

3

Reviews

1

Answers

5.0

Rating

1

Course

Spent 6 years as an in-house brand marketer, then pivoted to become a 4th-year product designer!

Currently pursuing a Master's degree in HCI Design at Yonsei University

I know better than anyone the strengths a designer who started as a non-major can possess.

I will generously share the know-how you need to become a planner or designer who remains essential even in the age of AI!

More

Reviews

All

3 reviews

5.0

3 reviews

  • jw5316617님의 프로필 이미지
    jw5316617

    Reviews 1

    Average Rating 5.0

    5

    73% enrolled

    It contains only the most essential information in a condensed format. This is an incredibly useful lecture for those who are handling data for the first time.

    • rok님의 프로필 이미지
      rok

      Reviews 7

      Average Rating 5.0

      5

      40% enrolled

      • birdwood39519님의 프로필 이미지
        birdwood39519

        Reviews 1

        Average Rating 5.0

        5

        33% enrolled

        Similar courses

        Explore other courses in the same field!

        25% off for new members

        $11.00

        25%

        $11.00