inflearn logo

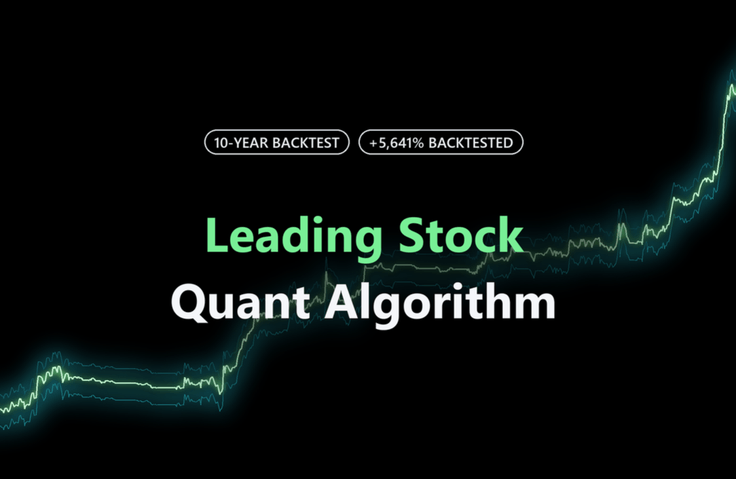
(Validated by a 10-Year Backtest) Quant Formula Revealed: 5641% Cumulative Return

***An overwhelming dataset that eliminates survivorship bias shows a maximum principal loss of just -1.98% over the past 10 years ***Backtesting verified at an annualized compound return of approximately 52.68%, with slippage, taxes, and fees conservatively factored in ***Backtested results verified with 10 years of Buy & Sell charts, plus an automated trading program provided

4 learners are taking this course

Level Beginner

Course period Unlimited

Financial Technology
Investment
Investment
Algorithm
Algorithm
Java
Java
Financial Technology
Investment
Investment
Algorithm
Algorithm
Java
Java

What you will gain after the course

  • PDF research report on a quantitative trading strategy with a validated 10-year backtest and a 52% annualized compound return

  • An automated trading program that can be installed on my PC and run immediately without complicated coding.

"Are you still trading based only on a few charts and gut instinct? Do you know the exact mathematical probability, in numbers, that the stock you bought will make a profit amid a market-wide surge?"


We conducted an exhaustive study of leading stocks that saw [daily trading value] surge in the Korean stock market over the past 10 years, selected those that fit the strategy, and validated them through simulations. We provide both a PDF ebook report of real-world quant data results, which quantifies the precise entry and exit formula mechanisms of swing trading and the maximum drawdown (MDD) risk filter using statistical tables and graphs, and the B14 automated trading program, which executes this proven strategy with a single click every day.


━━━━━━━━━━━━━━━━━━━━

"Why does the top spot in the returns competition change every time?"


If you take ads promising 5% daily returns at face value, you’d end up with an absurd 54 trillion won after 12 months.

Returns of several hundred percent in a short period. It’s easy to be tempted by explosive performance, but strategies that show only high short-term returns during a particular period are likely flash-in-the-pan strategies that work only under that period’s market conditions. Since market conditions are constantly changing, these strategies stop working when market trends shift, and


Just as the top performer in return competitions changes every time, strategies that work only in a particular market phase—for as little as a month or, at most, just over a year—can never last. The true value of investing lies not in strategies that work only in certain market phases, but in sustainability that can withstand any market conditions.

This report statistically exposes the harsh truth about why widely known strategies like the Golden Cross and common trading methods can bankrupt accounts in a 10-year backtest.


** This package transparently includes [10 years of actual trading records (Buy & Sell charts)] verified by applying the actual system formulas as-is, allowing you to see for yourself how reliable the historical data is.**

Verified data from a real 10-year simulation (backtest) is available

• Total sample size: 758 signals — We included even 460 delisted stocks and checked every day the criteria were met, without leaving any out.


• Reward-to-risk ratio: 1.72 (before costs) — average gain of +16.17% on winning trades and average loss of −9.41% on losing trades


• Break-even (BEP) threshold: 37.1% (after costs) — this book’s strategy had an actual win rate of 55.5%, exceeding the threshold by 18.4 percentage points.


• Expected return per trade: +5.04% (before costs) / +4.73% (after costs)

To briefly summarize the simulation results in three numbers (based on Premium Package v 3.1),

• Average annual compound return: 52.68%


• Risk-reward ratio: 1.72

• Maximum drawdown based on principal (MDD): Both versions of the automated trading program with position-sizing functionality are around -1.98 to -3%. As you can see in the video of the backtest using real data (if the video occasionally doesn’t play, please try refreshing several times), this shows that there has been no loss of principal since the initial investment in early 2017.


The results above are based on a seed capital of 30 million won, but testing with 3 million won—one-tenth of the benchmark seed—yields almost identical performance.

A nearly flawless quant algorithm that high-net-worth investors and professional traders—disappointed by the cheap, low-grade formulas on the market that have thin order books and low trading volumes, making them impossible to use for actual trades—can’t help but trust. For full-time investors struggling with monthly losses of tens of millions of won, it provides an investment navigator that makes decisions based on numbers rather than gut instinct.


[Limited Offer] Early-bird pricing for the first round of each package

(The algorithms proven over 10 years and basic trading strategies are the same across all three packages. However, depending on the version of the automated trading program, 'fund allocation and position adjustment' are controlled with varying levels of precision)


This product is available at a discounted price during the launch special offer period, and will return to its regular price once the event ends.


• [Basic] B14 Strategy Master PDF: The principles and algorithms of the B14 trading strategy, validated over 10 years.

This is an essential guidebook containing conditional search formulas. (9.6-year backtest return verified: 1,950.3%)


• [Premium] B14 Strategy Master PDF & featuring B14 position sizing (fund management) functionality

Includes an automated trading program. (9.6-year backtest return verified: 5.641.4%)

The B14 strategy algorithm features a “position sizing (money management) system” for maximizing profits.

It is a combined edition.


It’s your choice whether to keep wasting millions of won each month and draining your account on unverified scam trading chat rooms, or make one rational decision, get your hands on a complete 10-year answer key, and achieve financial independence.


⚠️ [Important] Legal Notice Before Purchase

  • All figures presented by this service (an average annual return of approximately 35% over the past 10 years, a win rate of 56.6%, a risk-reward ratio of 1.71, and an expected value of 5.041% per trade) are statistical 'research findings and expected values' based on backtesting using historical market data from the past 10 years. Expected values may vary by period depending on market conditions (range-bound or sharply rising markets).

  • In live trading, actual results may differ from the simulation due to trading fees, slippage (execution discrepancies), unexpected market events, and other factors.

  • This material is a knowledge-based creative work (software) intended for investment reference purposes only. The final investment decision and responsibility rest entirely with the investor. (This service complies with the laws and regulations governing quasi-investment advisory businesses and does not provide any personalized investment advice or trade signals.)


Recommended for
these people

Who is this course right for?

  • Busy full-time or working investors who spend hours every day struggling with complex coding and chart analysis.

  • High-net-worth individuals who urgently need an objective, proven quantitative trading system to replace tedious manual trading and emotionally driven decisions.

Need to know before starting?

  • You can set it up right away by following the manual included in this package, even without any programming (coding) knowledge.

  • A Windows PC environment and a Kiwoom Securities Open API environment are required.

Hello
This is jayj0307

Hello, I am a knowledge sharer who develops data- and numbers-based quantitative trading algorithms and automated systems.

Rather than trading based on intuition or emotions, I research and implement systems validated against more than 10 years of historical market data (backtesting) and systematic trading algorithms focused on clear win rates, MDD (maximum drawdown), and expected value.

---

🛠️ Key Areas of Expertise & Skills

* Quant Trading Strategy: Design backtesting engines for stock/index markets and develop quantitative trading strategies

* Python Development: Python-based data collection, backtesting automation, and trading program modularization

* Specification-Driven Design: Build stable trading code through clear specifications and modularization

---

🎯 Knowledge-Sharing Goals

We deliver practical know-how for implementing trading logic based on data validated in real markets directly through code and e-books. Rather than complex theory, we will help you with your investment and development based on "practical structures you can apply right away" and "validated figures".

📧 Inquiries & Communication: If you have any questions, please feel free to leave them via Inflearn messages or the Q&A section within the course or content. As I’m still new to sharing knowledge, I’ll gradually adapt to the Inflearn platform’s features and communication tools and do my best to provide the best possible support.

More

Curriculum

All

3 lectures

Course Materials:

Lecture resources
Published: 
Last updated: 

Reviews

Not enough reviews.
Please write a valuable review that helps everyone!

Similar courses

Explore other courses in the same field!

Limited time deal

$686.40

9%

$762.30