We collected valuable feedback received over the past year and published it in March 2020.
The existing “Chapter 1 Nationwide New Private Apartment Sales Price Trends” has been completely renewed.
As of Chapter 1, the explanations and visualizations have become much more detailed, from 9 videos (1 hour and 41 minutes) to 20 videos (3 hours and 25 minutes) .
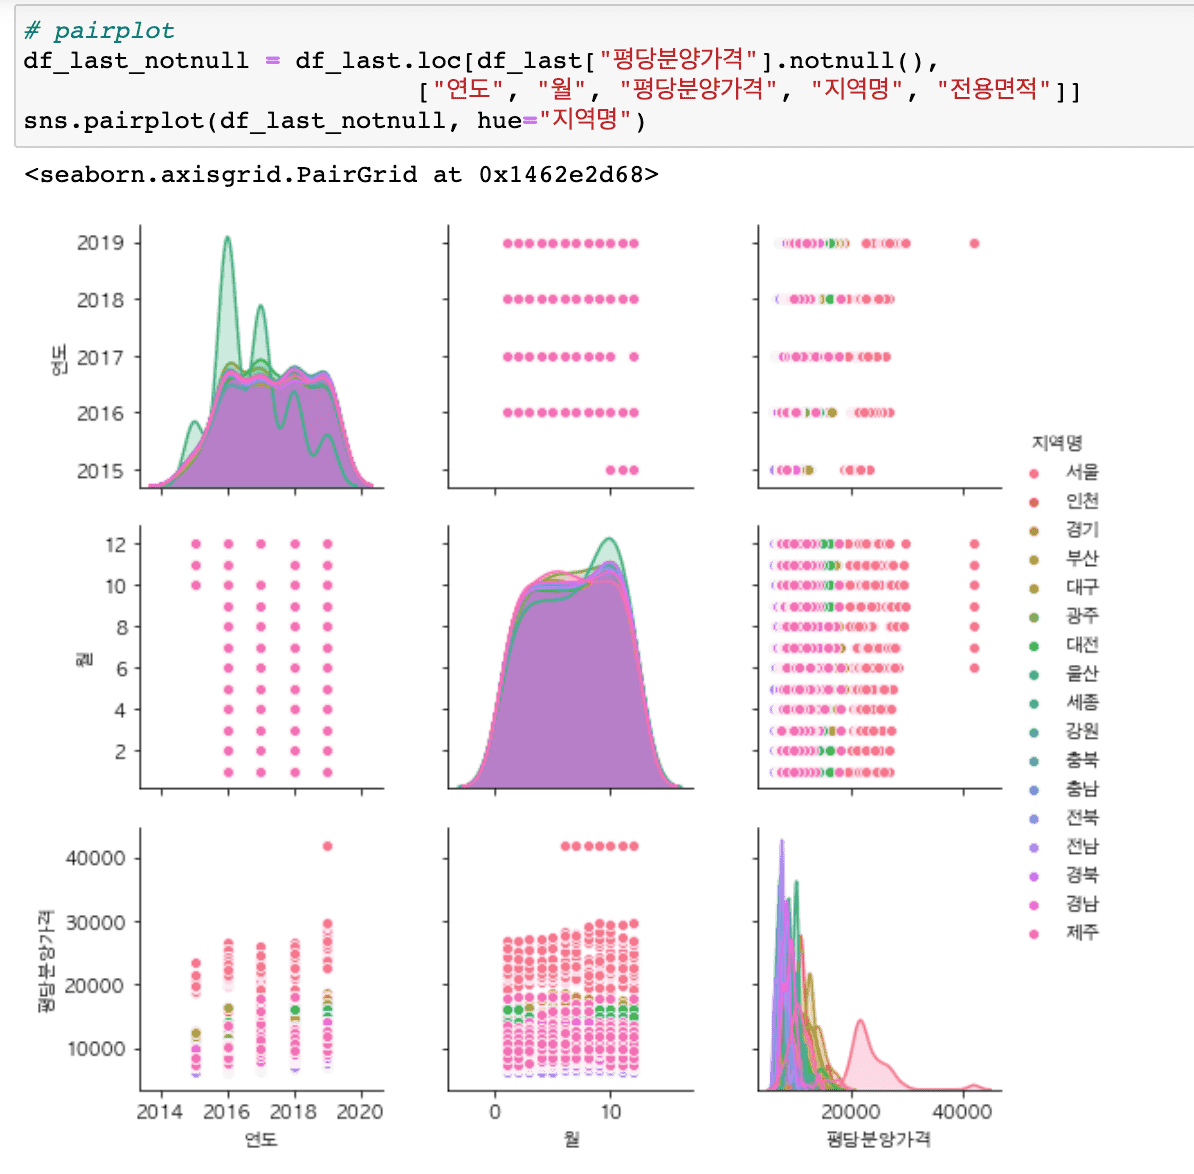
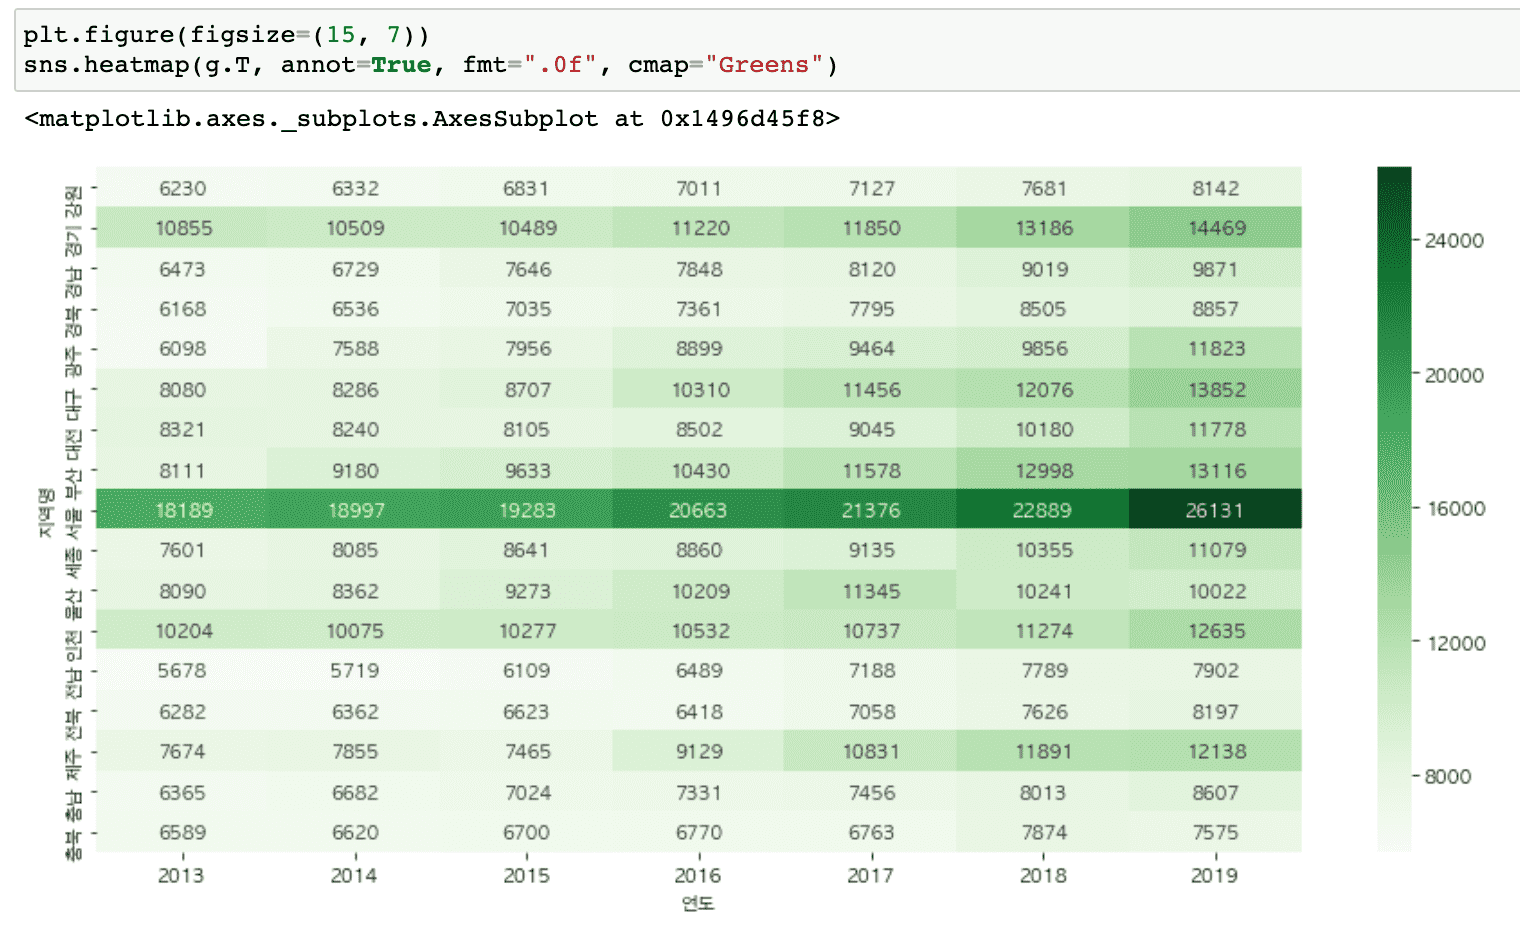
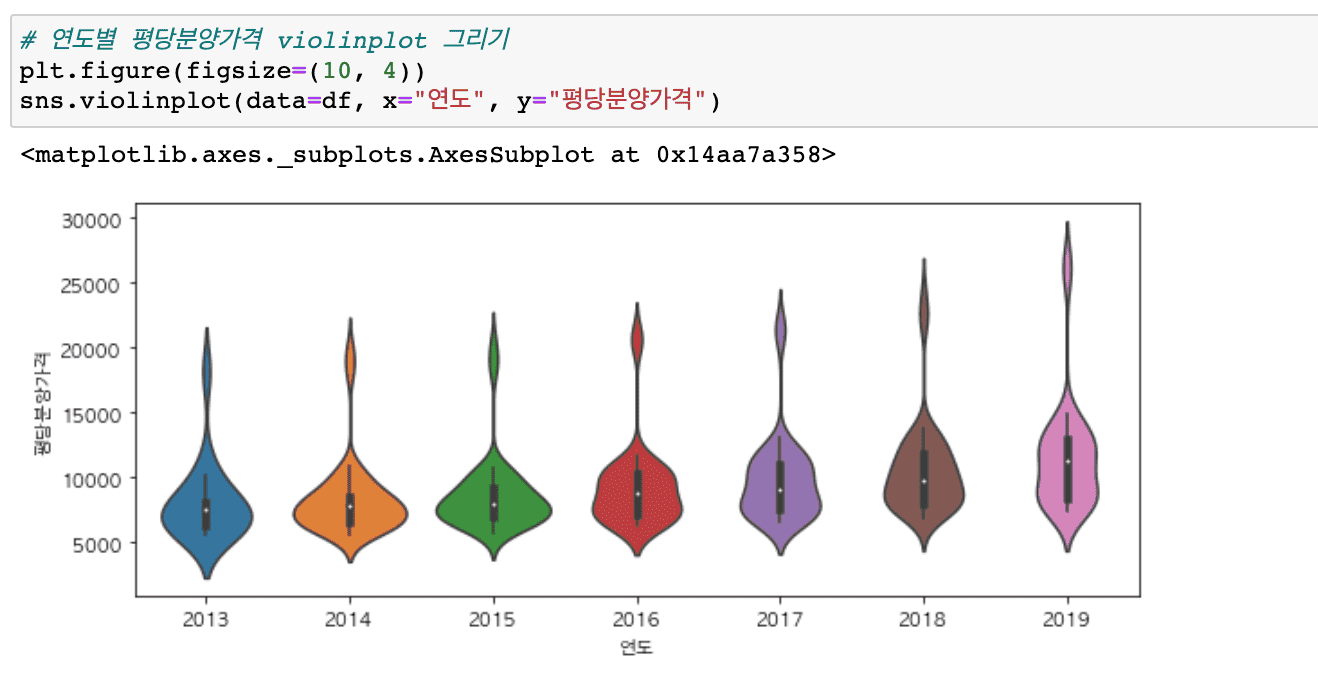
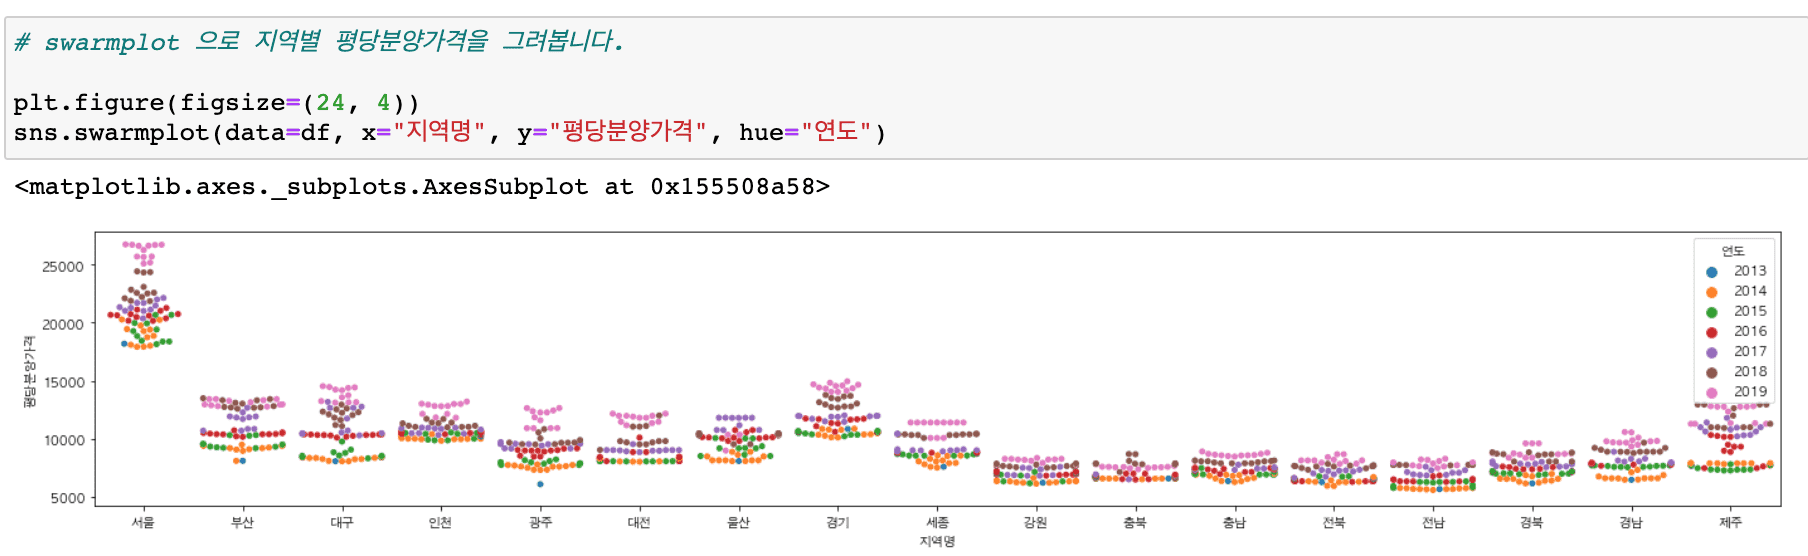
It covers a wider variety of graphs than before (heatmaps, histograms, distributions, scatter plots, regression graphs, etc.) and includes content that makes it easy to draw subplots.
We also provide practice code and result code.
Try using the practice file ( 01-apt-price-input.ipynb ) that provides a simple guide to follow along with the code while watching the video, and the file (01-apt-price-output.ipynb) that displays the results .
Please refer to the video introduction for the code location and google colaboratory path!
Tutorials for other chapters will also be renewed in March 2020!
thank you