인프런 커뮤니티 질문&답변
클라우데라 매니저 "알 수 없는 상태" 문의
작성
·
979
0
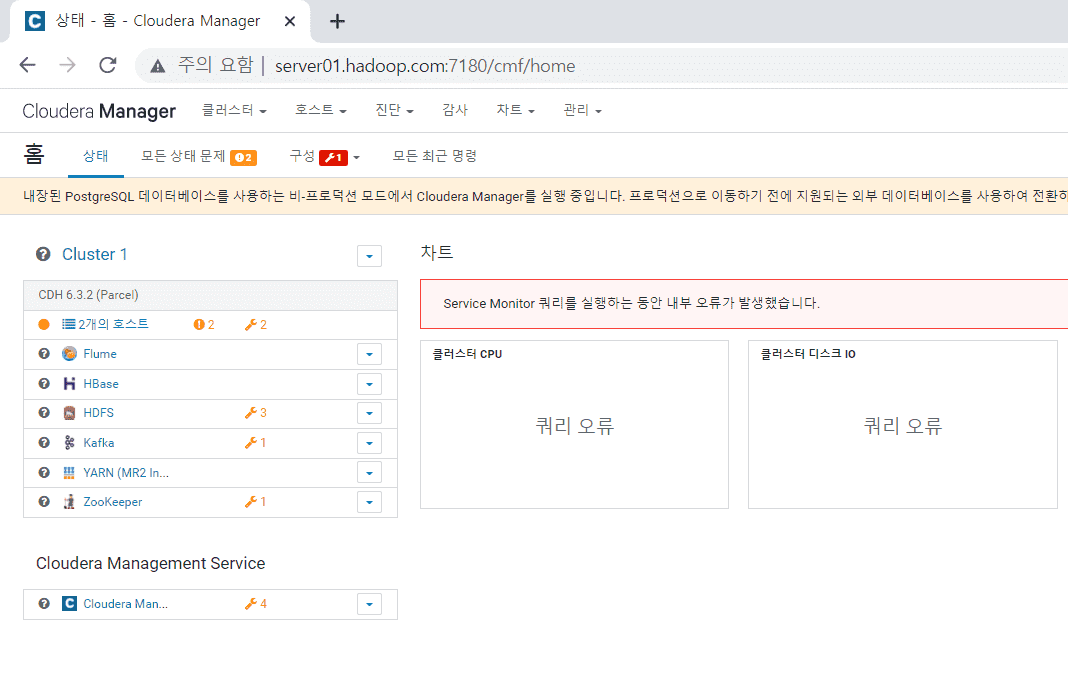
클라우데라 매니저를 실행하면 언제부턴가 아래처럼 모두 "알 수 없는 상태"로만 나옵니다.
재시작을 해봐도 계속 그렇구요.. 일단 무시하고 계속 수업을 따라가고 있고 아직까진 별 문제는 없는 것 같은데, 왜 저렇게 나오는걸까요?
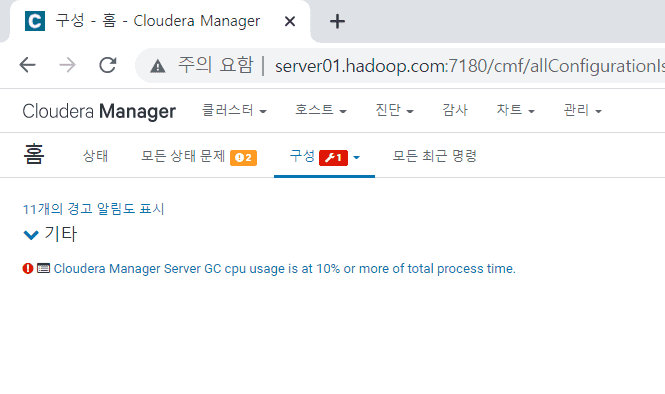
일단 위 경고를 보고 구글링해보니 sysctl -w vm.swappiness=10 을 입력하면 된다고 해서 putty에 입력했습니다.
그래도 여전히 모두 알 수 없는 상태이고 경고도 여전히 있습니다.
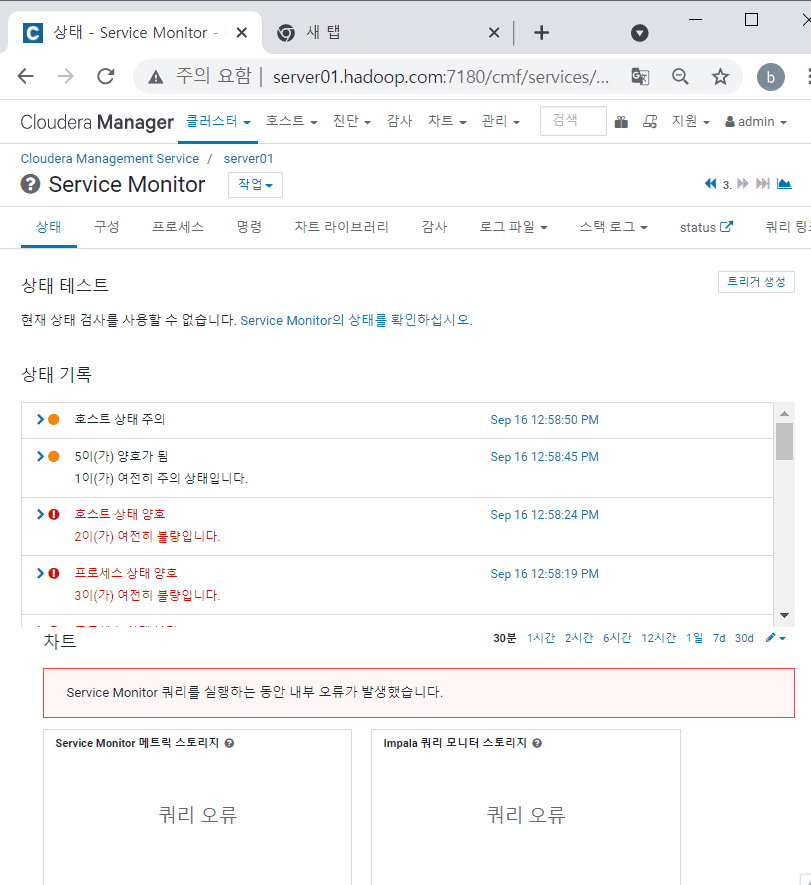
찾아보다 service monitor 문제인가 해서 확인해보았습니다.
상태 기록은 너무 많아서 글로 넣겠습니다(가장 위가 최신입니다.)
근데 봐도 뭘 어떻게 해야할지 모르겠네요ㅠ
뭐가 문제인걸까요?
호스트 상태 주의
The health test result for SERVICE_MONITOR_HOST_HEALTH has become concerning: The health of this role's host is concerning. The following health tests are concerning: swapping.
5이(가) 양호가 됨
1이(가) 여전히 주의 상태입니다.
The health test result for SERVICE_MONITOR_ROLE_PIPELINE has become good: 0 messages dropped by the role stage in the Service Monitor Pipeline over the previous 5 minute(s).
The health test result for SERVICE_MONITOR_SCM_DESCRIPTOR_FETCH has become good: The Cloudera Manager descriptor was refreshed 521 millisecond(s) ago.
The health test result for SERVICE_MONITOR_METRIC_SCHEMA_FETCH has become good: The Cloudera Manager metric schema was refreshed 569 millisecond(s) ago.
The health test result for SERVICE_MONITOR_UNEXPECTED_EXITS has become good: This role encountered 0 unexpected exit(s) in the previous 5 minute(s).
The health test result for SERVICE_MONITOR_PAUSE_DURATION has become good: Average time spent paused was 808 millisecond(s) (1.35%) per minute over the previous 5 minute(s).
호스트 상태 양호
2이(가) 여전히 불량입니다.
The health test result for SERVICE_MONITOR_HOST_HEALTH has become good: The health of this role's host is good.
프로세스 상태 양호
3이(가) 여전히 불량입니다.
The health test result for SERVICE_MONITOR_SCM_HEALTH has become good: This role's status is as expected. The role is started.
프로세스 상태 불량
The health test result for SERVICE_MONITOR_SCM_HEALTH has become bad: This role's host has been out of contact with Cloudera Manager for too long.
3이(가) 불량이 됨
1이(가) 주의가 됨
8이(가) 양호가 됨
The health test result for SERVICE_MONITOR_SCM_DESCRIPTOR_FETCH has become bad: The Cloudera Manager descriptor was refreshed 28 minute(s), 38 second(s) ago. Critical threshold: 2 minute(s).
The health test result for SERVICE_MONITOR_METRIC_SCHEMA_FETCH has become bad: The Cloudera Manager metric schema was refreshed 28 minute(s), 38 second(s) ago. Critical threshold: 2 minute(s).
The health test result for SERVICE_MONITOR_HOST_HEALTH has become bad: The health of this role's host is bad. The following health tests are bad: agent status.
The health test result for SERVICE_MONITOR_SWAP_MEMORY_USAGE has become concerning: 13.4 MiB of swap memory is being used by this role's process. Warning threshold: 200 B.
The health test result for SERVICE_MONITOR_AGGREGATION_RUN_DURATION has become good: The last metrics aggregation run duration is 852 millisecond(s).
The health test result for SERVICE_MONITOR_SCM_HEALTH has become good: This role's status is as expected. The role is started.
The health test result for SERVICE_MONITOR_FILE_DESCRIPTOR has become good: Open file descriptors: 553. File descriptor limit: 65,536. Percentage in use: 0.84%.
The health test result for SERVICE_MONITOR_LOG_DIRECTORY_FREE_SPACE has become good: This role's Log Directory (/var/log/cloudera-scm-firehose) is on a filesystem with more than 10.0 GiB of its space free.
The health test result for SERVICE_MONITOR_HEAP_DUMP_DIRECTORY_FREE_SPACE has become good: This role's Heap Dump Directory (/tmp) is on a filesystem with more than 10.0 GiB of its space free.
The health test result for SERVICE_MONITOR_WEB_METRIC_COLLECTION has become good: The web server of this role is responding with metrics. The most recent collection took 2.2 second(s).
The health test result for SERVICE_MONITOR_HEAP_SIZE has become good: Heap used: 164M. JVM maximum available heap size: 256M. Percentage of maximum heap: 64.06%.
The health test result for SERVICE_MONITOR_STORAGE_DIRECTORY_FREE_SPACE has become good: This role's Service Monitor Storage Directory (/var/lib/cloudera-service-monitor) is on a filesystem with more than 10.0 GiB of its space free.
15이(가) 알 수 없음이 됨
The health test result for SERVICE_MONITOR_ROLE_PIPELINE has become unknown: Not enough data to test: Test of whether the Service Monitor's role pipeline is dropping messages.
The health test result for SERVICE_MONITOR_SCM_DESCRIPTOR_FETCH has become unknown: Not enough data to test: Test of whether the Cloudera Manager descriptor is up to date.
The health test result for SERVICE_MONITOR_METRIC_SCHEMA_FETCH has become unknown: Not enough data to test: Test of whether the Cloudera Manager metric schema is up to date.
The health test result for SERVICE_MONITOR_AGGREGATION_RUN_DURATION has become unknown: Not enough data to test: Test of whether the metrics aggregation takes too long.
The health test result for SERVICE_MONITOR_SCM_HEALTH has become unknown: Not enough data to test: Test of whether the process state of this role is as expected.
The health test result for SERVICE_MONITOR_UNEXPECTED_EXITS has become unknown: Not enough data to test: Test of whether a role has encountered unexpected exits
The health test result for SERVICE_MONITOR_FILE_DESCRIPTOR has become unknown: Not enough data to test: Test of whether this role has too many open file descriptors.
The health test result for SERVICE_MONITOR_SWAP_MEMORY_USAGE has become unknown: Not enough data to test: Test of whether the role is using swap memory.
The health test result for SERVICE_MONITOR_LOG_DIRECTORY_FREE_SPACE has become unknown: Not enough data to test: Test of whether this role's log directory has enough free space.
The health test result for SERVICE_MONITOR_HEAP_DUMP_DIRECTORY_FREE_SPACE has become unknown: Not enough data to test: Test of whether this role's heap dump directory has enough free space.
The health test result for SERVICE_MONITOR_HOST_HEALTH has become unknown: Not enough data to test: Test of whether the host running this role is healthy.
The health test result for SERVICE_MONITOR_WEB_METRIC_COLLECTION has become unknown: Not enough data to test: Test of whether this role's web server is responding to requests for metrics.
The health test result for SERVICE_MONITOR_PAUSE_DURATION has become unknown: Not enough data to test: Test of whether this role's threads are being scheduled appropriately.
The health test result for SERVICE_MONITOR_HEAP_SIZE has become unknown: Not enough data to test: Test of whether this role needs more heap
The health test result for SERVICE_MONITOR_STORAGE_DIRECTORY_FREE_SPACE has become unknown: Not enough data to test: Test of whether the Service Monitor Storage Directory has enough free space.
답변 1
0
안녕하세요! 빅디 입니다.
서비스들의 모니터링 정보들이 "알수 없는 상태"로 표기 되는건 좌측 하단의 Cloudera Management Service 가 정지 되어 있기 때문입니다.
앞선 강의에서요.. "파일럿 PC환경에선 자원 부족이 발생 할 수 있고, 이를 위해 모니터링 역할만 하는 Cloudera Management Service를 종료 하는게 좋습니다." 라고 설명 하면서 정지 하는 과정이 있었습니다. 아마 이 부분의 내용을 잠시 놓치신것 같습니다. ^^;
Cloudera Management Service 를 시작 시키고 약 5~10분 정도 기다리면 모니터링 상태가 정상 표기 될겁니다.
참고로 조치 하셨던 메모리 스왑 옵션은 아래 명령을 통해 다시 100으로 설정해 주세요~
$ sysctl -w vm.swappiness=100
이유는 파일럿 환경에선 메모리가 부족 하기때문에 디스크에 메모리를 스왑하는 기능을 적극적으로 써야 하기 때문 입니다.
- 빅디 드림


"파일럿 PC환경에선 자원 부족이 발생 할 수 있고, 이를 위해 모니터링 역할만 하는 Cloudera Management Service를 종료 하는게 좋습니다."
-> 저도 이 말씀 듣고 정지시켜놨는데, '알 수 없는 상태'가 안 뜨게 하려면 다시 켜야한다는 말씀이시죠? 음.. 근데 다시 켜 놓고 한참이 지나도 그대로 알 수 없는 상태였던 것 같은데... 일단 다시 시도해보겠습니다! 감사합니다!