인프런 커뮤니티 질문&답변
1.7.6 강의 질문
작성
·
700
2
regplot, lmplot, swarmplot 실행을 하면 RuntimeWarning, UserWarning이 발생하네요.
regplot, lmplot 실행시 발생하는 경고
C:\*\anaconda3\envs\Test\lib\site-packages\numpy\linalg\linalg.py:1965: RuntimeWarning: invalid value encountered in greater large = s > cutoff
swarmplot 실행 시 발생하는 경고
C:\*\anaconda3\envs\Test\lib\site-packages\seaborn\categorical.py:1282: RuntimeWarning: invalid value encountered in less off_low = points < low_gutter C:\*\anaconda3\envs\Test\lib\site-packages\seaborn\categorical.py:1286: RuntimeWarning: invalid value encountered in greater off_high = points > high_gutter C:\*\anaconda3\envs\Test\lib\site-packages\seaborn\categorical.py:1296: UserWarning: 60.4% of the points cannot be placed; you may want to decrease the size of the markers or use stripplot. warnings.warn(msg, UserWarning) C:\*\anaconda3\envs\Test\lib\site-packages\seaborn\categorical.py:1296: UserWarning: 82.5% of the points cannot be placed; you may want to decrease the size of the markers or use stripplot. warnings.warn(msg, UserWarning) C:\*\anaconda3\envs\Test\lib\site-packages\seaborn\categorical.py:1296: UserWarning: 72.9% of the points cannot be placed; you may want to decrease the size of the markers or use stripplot. warnings.warn(msg, UserWarning) C:\*\anaconda3\envs\Test\lib\site-packages\seaborn\categorical.py:1296: UserWarning: 73.4% of the points cannot be placed; you may want to decrease the size of the markers or use stripplot. warnings.warn(msg, UserWarning) C:\*\anaconda3\envs\Test\lib\site-packages\seaborn\categorical.py:1296: UserWarning: 71.7% of the points cannot be placed; you may want to decrease the size of the markers or use stripplot. warnings.warn(msg, UserWarning)
답변 3
1
1
안녕하세요.
Seaborn 버전이 업데이트 되면서 점을 하나씩 찍어 표현하는 그래프 scatter, reg, lm, swarm, strip plot 에서 찍을 점이 너무 많을 때 이런 경고메시지가 발생합니다. 구 버전에서는 겹쳐서 찍혔었는데 버전이 업데이트 되며 데이터를 좀 더 정확하게 표현할 수 있도록 알려주는 메시지라고 보시면 될것 같아요.
swarmplot 의 경고메시지는 size라는 옵션을 추가해서 size=1 로 점의 크기를 줄여보세요.
그러면 해당 경고메시지가 줄어들거나 사라지게 됩니다.
그리고 점의 크기를 좀 더 크게 하고 싶다 생각되시면 숫자를 1~5 사이로 변경해 보세요.
해당 경고메시지는 일부 점이 겹치거나 누락되어 표현할 수 없으니 마커의 사이즈를 줄여달라는 의미에요.
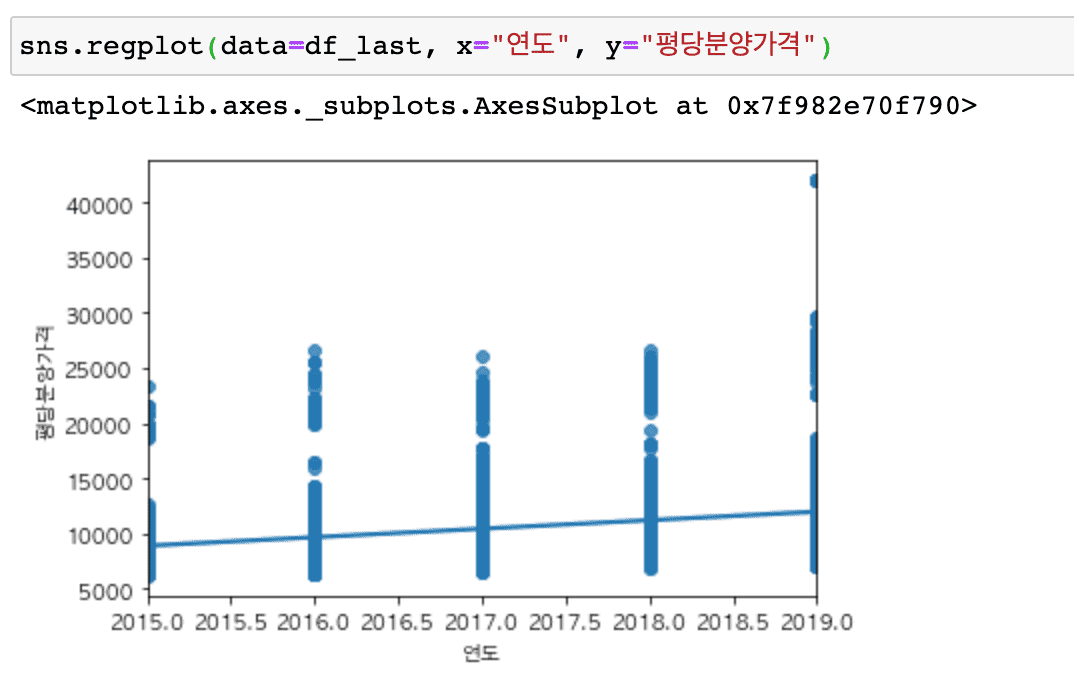
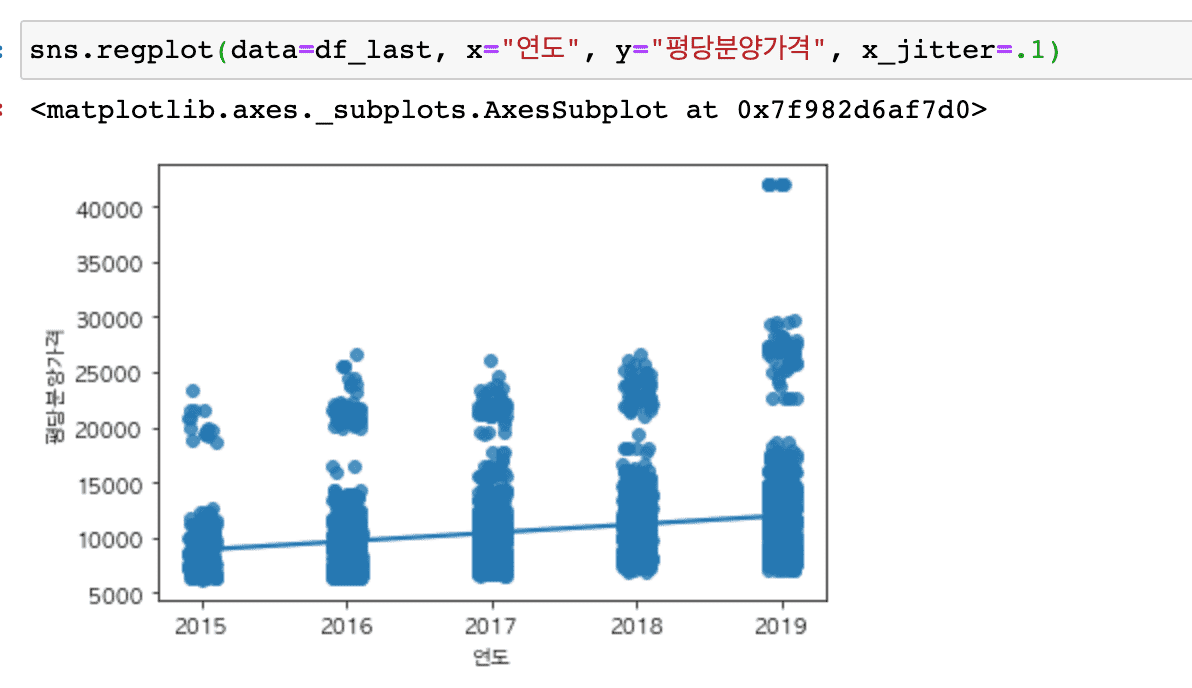
regplot과 lmplot에서는 x_jitter 옵션을 추가해 보세요.
sns.regplot(data=df_last, x="연도", y="평당분양가격", x_jitter=.1)
sns.lmplot(data=df_last, x="연도", y="평당분양가격", hue="전용면적", col="전용면적", col_wrap=3, x_jitter=.1)
x_jitter 를 사용 안 할 때

x_jitter 를 사용할 때

또, 현재 버전이 최신 버전이라면 distplot을 사용할 때도 경고 메시지가 뜰 수 있는데 아래 질문 답변 내용도 함께 참고해 주세요.
그리고 해당 강의 내용은 seaborn 업데이트에 맞춰 내년 상반기 업데이트 예정에 있습니다.
[인프런 - futuer warning](https://www.inflearn.com/questions/106195)
0
