


Distributed Tracing Systems in Architectures with Hundreds of MSA Services, as Explained by a Kakao Interviewer
Learn the process of building essential Observability in a Microservices Architecture (MSA) environment, from the basics to practical application. You will master standardized data collection using OpenTelemetry, trace storage and search via Grafana Tempo, and visualization using TraceQL through step-by-step hands-on exercises. You will learn how to track service flows, identify bottlenecks, and analyze the root causes of failures through distributed tracing.
It was great for quickly learning the essentials, thank you.
5.0
두두
100% enrolled
Trusted Online Classes
What you will gain after the course
Request Tracking and Performance Analysis Techniques Between Microservices Using OpenTelemetry and Grafana Tempo
Service separation by domain, HTTP communication between services, system design
Multi-container environment configuration, network management, and service discovery via Docker Compose
System monitoring and tracing-based operations through Grafana, Tempo, and otel-collector
YAML-based configuration management, service composition via environment variables, and declarative infrastructure definition methods.
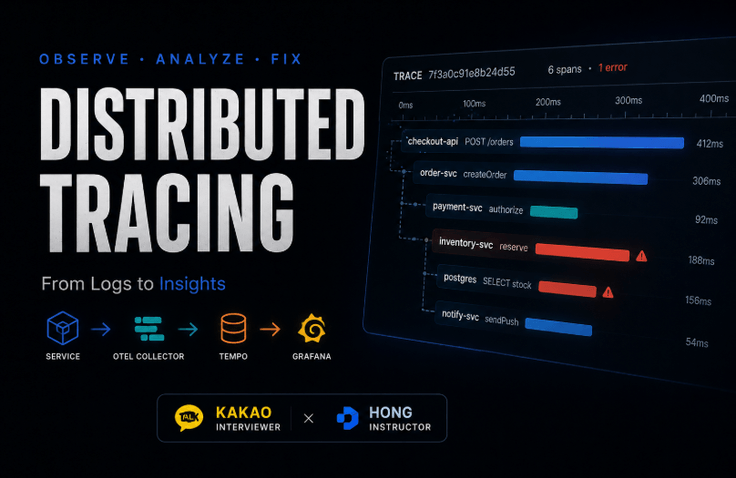
TRACE 7f3a0c91e8b24d55 · 6 spans · 1 error
If you are opening logs from three different places at the same time
A single request passes through multiple services. However, logs are accumulated separately for each service. If you are opening multiple windows and trying to align the timestamps to find where the slowdown occurred, there is a tool that does that work for you.
Difficulty: Beginner
Docker Practice
OpenTelemetry
Grafana · Tempo
Unlimited access period
0ms100200300400
checkout-api POST /orders412ms
order-svc createOrder306ms
payment-svc authorize92ms
inventory-svc reserve188ms
postgres SELECT stock156ms
notify-svc sendPush54ms
One service per line. The indentation represents the call depth, the starting position of the bar indicates when it started, and the length represents how long it took. The section highlighted in red in inventory-svc is the reason why this request became slow.
The goal of this lecture is to create this single screen. If logs are dots, tracing is a line.
SPAN 01 · Problem Definition
Dividing services makes it harder to find the cause.
NOW
Digging through logs
You open the logs for each service and try to align the timestamps. If there are three services, you have three windows open, and without a request ID, it's impossible to tell which lines belong to the same request.
WITH TRACING
The path is visible as a single line
A single ID is attached to a request, connecting the path as it travels across services. How many milliseconds were spent in each section and where it was disconnected are all recorded on a single screen.
The advantages of MSA are often discussed, but the cost is rarely mentioned. You must add observability in proportion to how much you have divided the services to regain your original debugging capabilities.
SPAN 02 · Start
This is an actual conversation that took place.
It all started with a complaint I vented to an acquaintance who works as a developer at Kakao.
HHongSomething I've been worried about lately is that debugging is so difficult because the coupling between services in MSA is so high. Is this normal?
KKakao DeveloperEveryone looks at logs and metrics, and if the environment is well-established, they check tracing too. I usually debug while looking at tracing.
HHongI'm jealous. It would be so helpful if we had a system like that. My eyes are about to pop out from looking at logs.
KKakao DeveloperMost people usually only look at logs, but it's really great once you understand and implement the concept of tracing. It makes it easy to see the relationships between services and allows you to track the overall flow.
KKakao DeveloperAnd by introducing this tracing, you can solve various problems that arise in MSA. People keep saying MSA is great, but most people don't seem to look at the downsides.
HHongThen please let me know. I've used it simply in other languages, but I haven't tried integrating it with Grafana yet.
KKakao DeveloperThen I'll quickly set up the Grafana and MSA environment using Docker and docker-compose and let you know.
SPAN 03 · Structure
The path data travels
Trace data is created in the service, passes through a collector to be stored in a repository, and is finally viewed on a screen. This course covers each of these four stages one by one.
STAGE 1
Service
Spans are created and exported for each request. Spans from multiple services are bundled into a single Trace.
STAGE 2
OTel Collector
It receives data through the Receiver, processes it with the Processor, and passes it to the Exporter. This is the core focus of this lecture.
STAGE 3
Tempo
It is stored in blocks. We will look at how it is accumulated and how to find it quickly.
STAGE 4
Grafana
Query with TraceQL. The top screen comes from here.
The Collector in the middle is the key. The service only needs to know the Collector, and even if you change the storage, the service code remains the same. Section 4 is entirely dedicated to the Collector.
SPAN 04 · Curriculum
What is covered and in what order
We will establish the concepts and storage structure, dive deep into the collector, and finally connect everything to run it.
01
Lecture Introduction and Materials
Course Introduction
Source Code [ Including Build ]
Lecture Summary Materials
Official OpenTelemetry Doc
02
Why distributed tracing systems are necessary and distributed tracing data
What is Grafana & The architecture we want to implement
Grafana & Tempo Architecture Integration Principles
Distributed tracing data structures and visualization principles
Debugging Correlations in a Distributed Tracing Environment
Section 2 Quiz
03
Grafana's Distributed Tracing System, Tempo
Grafana Tempo Overview and Design Philosophy
Grafana Tempo Microservices Architecture
Tempo Block-Based Storage Mechanism
Tempo Query Processing and Performance Optimization
Section 3 Quiz
04
Service Relationships in MSA Architecture: Everything About OpenTelemetry Collector
OpenTelemetry Collector Concepts and Roles
OpenTelemetry Collector Architecture and Components
In-depth Analysis of OpenTelemetry Receiver
In-depth Analysis of OpenTelemetry Processor
In-depth Analysis of OpenTelemetry Exporter
OpenTelemetry Collector Performance Optimization and Scalability
Section 4 Quiz
05
Building a lightweight environment and proceeding with the final hands-on practice
Configuring configuration files for Grafana, Otel, and Tempo components learned previously
Building a lightweight environment using Docker and Volume Mounts
Three servers for a simplified MSA architecture
Grafana & TraceQL: Checking distributed tracing data while writing queries
Section 5 Quiz
SPAN 05 · Components
Connect the things you've only heard of by name yourself.
We will write the configuration files one by one and verify what each element does.
OpenTelemetry Collector
Grafana Tempo
TraceQL
Receiver
Processor
Exporter
Trace & Span
Docker Compose
Volume Mount
YAML Configuration
It doesn't end with just reading. In the final section, you will set up the environment yourself and verify the tracing data with your own eyes.
Backend developers who have divided their services but don't know where to start looking when a failure occurs.
CASE 2
Those who are only looking at logs
Those who spend all their time trying to find the cause, only to end up narrowing it down based on intuition.
CASE 3
Curious about the perspective
Those who want to know what layers a skilled developer looks at when viewing a system.
CASE 4
Teams preparing for expansion
Developers who want to implement observability in advance as their services continue to grow.
SPAN 07 · Current Market
Stories about AI replacing developers
New recruitment is decreasing, and companies are trying to hire only those who are proven. These are articles that have come out in recent months.
2025Krafton, which achieved record-breaking performance, has begun downsizing its workforce. The reason given was to transition into an 'AI-first' company.
2025Software specialized companies are halting the recruitment of new developers. There are also projections that the hiring of entry-level developers will plummet by 77%.
2025 53% of game designers responded that "AI will replace my job." Cases of recommended resignation have also been reported.
As much as companies are feeling uneasy, those being hired must demonstrate a clearer distinction. Even when spending the same amount of time, the depth of explanation varies depending on what you look at and from what perspective.
SPAN 08 · Course Reviews
Stories from those who listened first
I copied this directly from the Inflearn course reviews.
I believe this is a lecture that helps you grow even further during the long Chuseok holiday. Although the lecture time is short, it is packed with incredibly great topics. It was highly effective for the time invested.
I like number 8 · Written after 86% completion
This lecture makes me feel ashamed of myself for only focusing on simple development without considering these kinds of details, and I feel like I've learned that much more. I've been taking all your courses, from the early ones to the most recent, and you're becoming a creator that I want to keep all to myself.
Jlos Ho · Written after 95% completion
It was great for quickly learning the core concepts. Thank you.
Tommy · Written after 100% completion
SPAN 09 · Created by
Created together by two current developers
KAKAO · BACKEND & DATA ENGINEER · INTERVIEWER
Choi
Having worked in the primary financial sector, I am now in charge of backend and data engineering at Kakao. As I am also active as an interviewer, what I look for in interviews is directly incorporated into the structure of this course.
"Once you apply tracing, you can never go back to the days when you only looked at logs."
Knowledge Sharer · Pangyo Platform Server Developer
Hong
I started as a non-major and am now developing platform backends in Pangyo. I make it a principle to create courses together with talented colleagues from the industry.
"The price paid for dividing services comes back during debugging. This is how you pay that price."
Q.Is it okay if I have no prior experience with monitoring?
⌄
The difficulty level is set to introductory. Section 2 starts with what Grafana is and what distributed tracing data looks like. It is structured so that you can follow along even if you have no experience with metric or log collection.
Q.How is it different from logs or metrics?
⌄
Logs record events happening within a single service as individual dots, while tracing connects the path a single request takes through various services as a line. It captures in a single view where delays occur and which service called which. Section 2 covers this correlation.
Q.Why is the OpenTelemetry Collector necessary?
⌄
It is a middle layer that eliminates the need for services to directly know about the storage. Since the Receiver, Processor, and Exporter are separated, the service code remains the same even if the storage is changed. The entirety of Section 4 covers these three pillars and performance optimization.
Q.What will we be building in the hands-on practice?
⌄
We will configure Grafana, Tempo, and Collector settings using Docker and volume mounts, and launch three servers that mimic a simplified MSA. Then, we will directly write TraceQL to query the trace data.
Q.Can I use tools other than Tempo?
⌄
This lecture proceeds with a combination of Grafana and Tempo. However, since the standard for exporting data from the service is OpenTelemetry and there is a Collector in between, the front-end structure can be reused as-is even if you switch to a different storage backend. That is also why we cover the Collector in depth.
View it as a line, not a point
To the extent that services are divided, observability must be added to regain the original debugging capabilities.
There is a separate space where you can discuss everything from parts you get stuck on while listening to lectures, questions that arise while applying concepts to your own service, to career stories. The places where you get stuck are usually where others get stuck as well.
I started studying development after becoming interested in it while idling at home, and I am currently responsible for platform server development in Pangyo. I am continuing my activities as a knowledge sharer because I want to provide you with the methods I used to study, as well as the various problems and solutions you may encounter in practice.
These lectures are not created solely through my own knowledge. There are others who collaborate on every lecture.
Hello Tommy, I tried my best to deliver the key points to you all in the shortest time possible. Because your time is so precious haha. Please leave a good review and I will continue to provide more useful lectures in the future. Thank you.