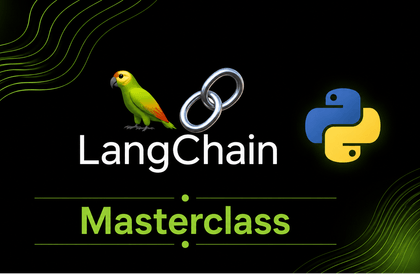
This course is designed for developers, AI enthusiasts, and professionals who want to develop real-world AI applications using LangChain, OpenAI, Hugging Face, and Python.
Rather than focusing solely on theory, this course takes a practical, project-oriented approach. Throughout the course, students will directly build a total of 15 high-quality AI applications, including chatbots, CSV analysis tools, resume screening systems, invoice extraction bots, support assistants, marketing tools, and text-to-SQL applications.
I created this course to make complex AI concepts easy to understand and to ensure modern LLM development is accessible to everyone. Many learners struggle to understand how tools like LangChain, embeddings, memory systems, vector databases, and AI agents interact in real-world applications. This course guides you step-by-step through clear explanations, hands-on coding sessions, and actual implementation workflows.
By the end of the course, students will confidently understand how to design, build, and deploy AI-powered applications using the latest generative AI technologies.


![[Data Preprocessing] Don't worry! Pandas is here.Course Thumbnail](https://cdn.inflearn.com/public/files/courses/336824/cover/01k5849rtc0vfa7df3revd2tpb?w=420)
![[Concept Class] Learn and Immediately Use PandasCourse Thumbnail](https://cdn.inflearn.com/public/courses/328195/cover/bd199baf-6c2e-49d9-8e2c-1bbe65eebbb3/pandas_main_img.jpg?w=420)
![Introduction to Python Backend with FastAPI for Beginners (From FastAPI to Asynchronous SQLAlchemy) [Full Stack Part1-2]Course Thumbnail](https://cdn.inflearn.com/public/courses/333248/cover/7323d828-100e-4ac9-8e6e-0e51a17ac741/333248.png?w=420)


![[Renewed] Python Machine Learning Bootcamp for Beginners (Easy! Learn by Solving Real Kaggle Problems) [Data Analysis/Science Part2]Course Thumbnail](https://cdn.inflearn.com/public/courses/327464/cover/55c4db7b-7764-43cc-ac75-d9e8d08098f1/327464-eng.png?w=420)