Complete practical skills from Excel dashboards to SQL and BigQuery data analysis
D3 LAB
$110.00
30%
$77.00
Intermediate / Excel, SQL, Tableau, dashboard, bigquery
3.0
(1)
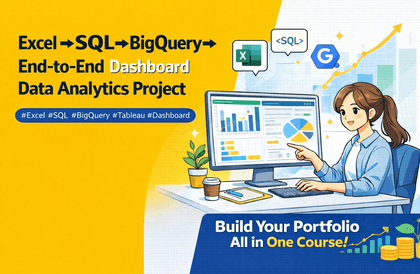
This course completes the entire workflow of practical data analysis, from Excel data analysis to SQL, BigQuery, and Tableau dashboards, through hands-on projects. Rather than just teaching you how to use the tools, you will learn the data analysis structures and mindsets actually used in real-world analysis tasks.
Intermediate
Excel, SQL, Tableau