inflearn logo
inflearn logo

Catch even the logs! Zabbix & Grafana Practical Integration Course

Add log collection, automated deployment, and real-time visualization to Zabbix! Are you receiving alerts with Zabbix but want to collect and visualize logs? Do you want to automatically deploy Zabbix Agents to hundreds of servers using Ansible? Do you want to check Webex notification logs with flashing alerts in Grafana? In this course, we provide practical, hands-on methods to further automate and visualize your real-time monitoring environment by integrating Zabbix with essential open-source tools: Grafana, Loki, Promtail, and Ansible.

(5.0) 4 reviews

27 learners

Level Intermediate

Course period Unlimited

HTML/CSS
HTML/CSS
SQL
SQL
Ansible
Ansible
grafana
grafana
zabbix
zabbix
HTML/CSS
HTML/CSS
SQL
SQL
Ansible
Ansible
grafana
grafana
zabbix
zabbix

What you will gain after the course

  • How to automatically install Zabbix Agent with Ansible and deploy it to production environments at scale

  • How to collect Webex alarm logs with Promtail + Loki and visualize them in real-time with Grafana

  • Configure the flow of failure detection → alarm transmission → log analysis based on the actual production environment.

  • Build an integrated dashboard by linking open-source monitoring tools such as Zabbix, Grafana, and Loki.

Why do server failures always seem to happen in the middle of the night? 🌙

In this course, you will automatically deploy Zabbix Agents using Ansible, and collect alarm logs with Loki + Promtail,
and finally build a real-time flashing dashboard in Grafana.

Go beyond simple monitoring and configure an end-to-end system that can actually be used in practice, from failure detection → alarm transmission → log visualization.

No more superficial installation tutorials. In this course, we will build a
Production Ready monitoring system that can be used in actual operating environments.


What can you learn from this course?

This course goes beyond simple server monitoring, aiming to complete an
End-to-End practical monitoring system that covers everything from
alarm generation → log collection → visualization → automated deployment.

  • Automated installation across dozens of Zabbix Agents (Ansible)

  • Save logs simultaneously with Webex notifications

  • Log collection and transmission via Loki + Promtail

  • Real-time visualization through Grafana Dynamic Text panels

  • Building a 'flashing' alert dashboard for when failures occur

This environment is very widely used in actual operational large-scale infrastructure, incident response systems, and DevOps environments.


🎯 Key Features of This Course

Most people only use Zabbix, but few places monitor logs as well.
In this course, we go beyond traditional monitoring using only Zabbix and
cover a practical configuration that completes a real-time log-based visualization environment..


Automated mass server installation with Ansible
Install dozens of Zabbix Agents all at once.
No more repetitive manual configurations. All servers are ready with just a single script.


Alarm + Log = Perfect Incident Response
When a failure occurs, an alarm is sent via Webex,
and simultaneously, logs are recorded and collected by Promtail → then displayed flashing in Grafana.
The era of only looking at alarms is over.


Practical configurations created from the perspective of an active operator
Focuses on actual configuration files and troubleshooting rather than conceptual explanations of the tools.
Structured based on "scenarios you may encounter in real-world operations."

Recommended for the following people

Those who know how to use Zabbix but want to create a more expanded automation/visualization environment

Those who want to build a monitoring system suitable for a DevOps environment

Infrastructure operators and system engineers who are tired of manual installation and log searching

✅ After taking this course?

  • You can automatically install Zabbix Agent on dozens of servers.

  • Webex alerts and log storage can be processed simultaneously.

  • You can create a real-time log dashboard with Promtail + Loki + Grafana.

  • In the event of an actual failure, you can quickly identify the root cause logs.

  • Beyond simple alerts, you can operate a true 'monitoring system'.

What you will learn.

Real-time Resource Monitoring Dashboard

You will learn how to
visualize key server metrics in real-time using Grafana, such as CPU, memory, disk IO, and file system status.

Based on the data collected by the Zabbix Agent,
we will build an operator dashboard that shows the performance status of each server at a glance.

Security Log Dashboard Implementation with Loki

You will learn how to collect /var/log/messages, /var/log/secure, and other
system logs, authentication logs, and disk error logs in real-time and how to
filter and visualize them in Grafana..

From Zabbix Alarms to Webex Messages to Grafana Visualization, all at a glance

In this course, you will learn how to send trigger alarms generated in Zabbix as
Webex messages and
visualize the details on a Grafana dashboard in real time.

Practical Architecture for Automated Installation with Ansible

Have you ever experienced installing Zabbix Agents one by one on dozens of servers?
In this course, you will learn how to automatically install and configure Zabbix Agents using Ansible.


Q&A

Q. Is it okay if I haven't taken the previous lecture?

A. Yes, that's fine!
Since we will be practicing everything from scratch within this course, from Zabbix installation to Agent configuration,
you will be fully able to follow along even if you haven't watched the previous lectures.

Q. Can I take this course even if I don't know Linux well?

A. It is possible if you know basic Linux commands.
In the lecture, each command is explained kindly, and you will be guided so that you can follow along by copying and pasting without complex coding or script writing.


Notes Before Taking the Course

Prerequisite Knowledge and Precautions

  • 💻 It will be easier to learn if you know basic Linux commands.

  • 🧱 It is good to know the basic concepts of Zabbix, but the course covers everything from installation again.

  • 💬 Even if you are new to Grafana / Loki / Ansible, you can learn by following the step-by-step hands-on practice.

  • 🌐 The practice will be conducted in a cloud environment (AWS).

  • 📁 All sample configuration files and scripts required for the practice are provided in the lecture.

Recommended for
these people

Who is this course right for?

  • System operators who currently use only Zabbix and want to incorporate automation and visualization.

  • DevOps engineers who want to build practical dashboards for log collection and troubleshooting.

  • Infrastructure/server administrators who want to reduce repetitive tasks through Ansible

  • Intermediate-level practitioners who want to learn about monitoring systems required for responding to actual incident situations.

Hello
This is yootong

929

Learners

64

Reviews

23

Answers

4.7

Rating

6

Courses

Everything about infrastructure practice directly from the field! 🌐
Hello. I'm Yuddong, working as an infrastructure engineer at a Lotte Group affiliate.

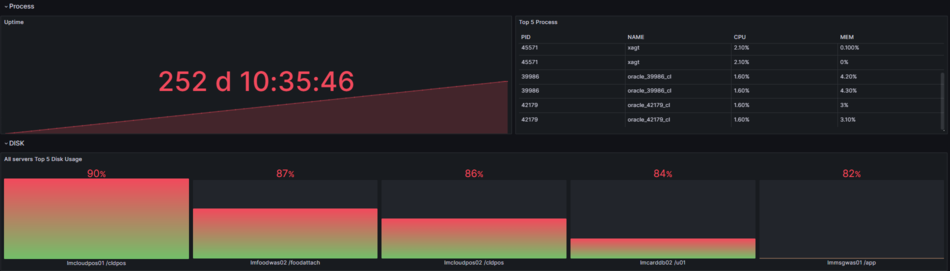
💻 I am an engineer responsible for overall IT infrastructure, including servers, networks, and databases, who has stably operated and monitored hundreds of systems while solving problems encountered in actual field environments.

🔥 I am growing every day with the goal of creating efficient, flexible, and scalable infrastructure rather than just a system that simply "works."

💡 "Solid foundations, practical knowledge you can use right away!"
👨🏻‍🏫 Not difficult, but definitely clear.

I am not a brilliant person, but I have made it this far by learning consistently without giving up.
You can do it too. I will always be by your side, helping you like a reliable professional partner!

More

Curriculum

All

33 lectures ∙ (6hr 59min)

Course Materials:

Lecture resources
Published: 
Last updated: 

Reviews

All

4 reviews

5.0

4 reviews

  • gilnyangyi6577님의 프로필 이미지
    gilnyangyi6577

    Reviews 5

    Average Rating 5.0

    5

    30% enrolled

    • frwrwr님의 프로필 이미지
      frwrwr

      Reviews 3

      Average Rating 5.0

      5

      82% enrolled

      It was totally worth the money. The core content is cleanly organized so you can apply it directly in real work, and I naturally understood it as I followed along. Thanks to this, I was able to immediately apply it to operations/monitoring tasks and it was a huge help.

      • yootong
        Instructor

        Thank you so much for your thoughtful review! 😊 Hearing that it was worth the money is the most rewarding thing for me as the course creator. I structured it focusing on the essentials so you could apply it directly in practice, and I'm glad that following along helped you understand it naturally—it seems my intention came through perfectly.

    • stduent님의 프로필 이미지
      stduent

      Reviews 4

      Average Rating 5.0

      5

      55% enrolled

      This was truly a perfect course. It was so engaging that I completed half of it in just one day, and for practitioners building monitoring systems, there's so much content that makes you think "I need to save this and keep watching it." It wasn't just a simple feature introduction, but provided step-by-step configuration and operational know-how that can be immediately applied in real-world practice, which was extremely helpful. Highly recommended.

      • yootong
        Instructor

        Thank you so much for your thoughtful review! 😊 I'm even more proud knowing that you completed half the course in just one day - I can really feel how immersed you were in it. As you mentioned, I focused on creating content with configuration/operation know-how that can be "immediately applied" in practice, so it's very encouraging to hear it was helpful. If you run into any issues while applying this in the field, please feel free to leave questions anytime!

    • 진심모드님의 프로필 이미지
      진심모드

      Reviews 2

      Average Rating 5.0

      5

      30% enrolled

      yootong's other courses

      Check out other courses by the instructor!

      Similar courses

      Explore other courses in the same field!

      $93.50