
inflearn logo

Starting with Quantitative Investment Backtest Validation — Tackling Overfitting in Python

Build a backtesting engine from scratch in about 300 lines, without external libraries, and use automated tests to prevent lookahead bias and omitted costs. The second half focuses on validation: filter out rules through slippage and execution-delay tests, walk-forward analysis, and data-snooping checks, then automatically generate a validation report for each rule.

1 learners are taking this course

Level Basic

Course period Unlimited

Python
Python
Statistics
Statistics
Financial Technology
Investment
Investment
Python
Python
Statistics
Statistics
Financial Technology
Investment
Investment

What you will gain after the course

  • A Python backtesting engine (about 300 lines) that structurally prevents future data and cost omissions, plus 28 pytest tests.

  • An execution model with slippage, tick size, a one-day delay, and volume limits, plus break-even slippage

  • Walk-forward validation and data snooping checks (randomization tests, adjusted p-values, block bootstrap)

  • An automatically generated 8-question validation report for each rule, an Excel report, and an asset curve graph

📏 Length: 16 lessons + 1 bonus · 25,750 characters of main text · 91 code blocks (excluding bonus) · 34 attached code tests passed (including 6 bonus tests) — about 234 minutes if you follow along with the code (excluding bonus; assuming 2 minutes per code block and 500 characters per minute)

Measured results from this course — exactly as shown in the manuscript’s code and results

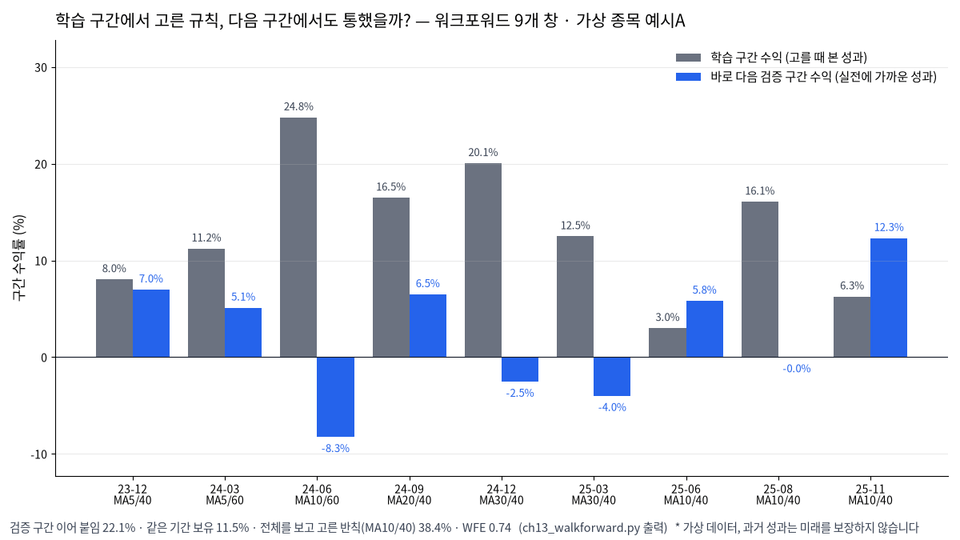
  • The moving-average combinations selected in the training period were positive across all 9 windows (3.0–24.8%), but when applied unchanged to the very next period, 4 were at or below zero. The walk-forward result, combining the validation periods, was 22.1%; the “cheating” result chosen after looking at the entire dataset was 38.4%—the difference shows the extent of overfitting (Example A, Lesson 13).

  • The top candidate among 16 (MA10/40, +47.9%) has a p-value of 0.103 when considered on its own, but the p-value adjusted to account for the fact that it was selected from 16 candidates is 0.746—indistinguishable from chance (Example A, Lesson 14)

  • The same RSI rule returned +65.5% in Example A and -75.9% in Example B. Example A’s 100% win rate is based on 5 trades (Lesson 10)

  • Even the rule that looked best, with cumulative returns of 65.5% vs. 3.8% for buy-and-hold, passed only 5 of the 8 validation report checks—it falls short due to just 5 trades, a bottom-5% bootstrap CAGR of -0.3%, and a worst-case bottom-5% MDD of -35.7% (Lesson 15)

  • Free previews of Lessons 0 and 1 — You can read how to use the course and “Five Ways Backtests Lie” before buying.

  • The numbers above are an example using simulated data with a fixed seed to demonstrate the validation method; they do not guarantee future returns.

"Did this rule really work in the past?" Check it with code before putting money in.

When you eyeball a chart, you only remember the times it worked. Fees and taxes get left out, and you fool yourself into thinking you bought at today’s closing price after seeing it.
In this course, you’ll build a backtesting engine yourself in about 300 lines of code, without external libraries to prevent these illusions, then use automated tests to verify that the engine doesn’t lie. The second half is all about validation: filter out rules by checking slippage and execution delays, walk-forward testing, and data snooping, and automatically generate a one-page validation report for each rule.

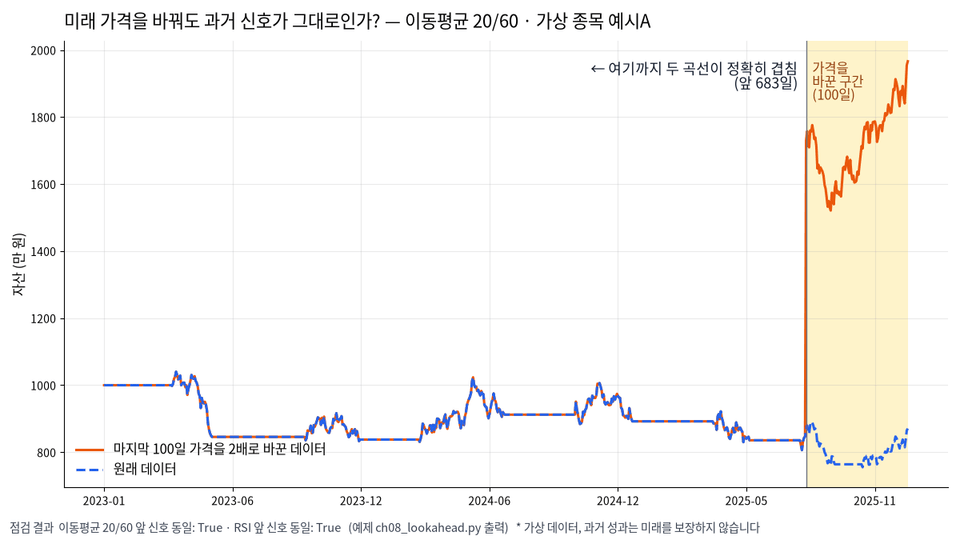
I deliberately doubled the prices of a hypothetical asset’s last 100 days and ran it again. If the signals and equity curve for the first 683 days don’t differ at all, this backtest hasn’t secretly used future prices (verify it yourself with the Chapter 8 example).

If you take the best-performing moving-average combination from the training period (gray) and apply it unchanged to the very next segment (blue, 63 trading days; only the final window, where the data ends, is 27 trading days), 4 out of 9 times it resulted in a loss or a 0% return. The walk-forward stitched result was 22.1%, while the “cheating” result—chosen after looking at the entire period in advance—was 38.4%. That gap shows the extent of overfitting. A WFE of 0.74 means the average daily return in the validation period was 74% of that in the training period (simulated data, Chapter 13 example. Past performance does not guarantee future results).

Recommended for the following people

  • Individual investors who want to evaluate their trading rules using numbers (cumulative return, CAGR, MDD, and win rate)

  • Those who know basic Python syntax (variables, lists, functions, and for loops) but don’t know where to start with building a backtest.

  • Developers who aren’t sure whether they can trust the results from backtesting libraries.

What You’ll Take Away from the Course

  • Five pitfalls that can make backtests misleading (look-ahead bias, omitted costs, survivorship bias, overfitting, and a single sample) and code to guard against each one.

  • Signals at the close, execution at the next day’s open—a trading simulation designed to structurally prevent the use of future data

  • Cost calculation that accurately accounts for fees and truncates amounts below one won for transaction taxes.

  • “Does the past signal remain unchanged when you alter the future?” test—a lie detector you can attach to any rule

  • Summary and trade history Excel report, equity curve and drawdown charts

  • An execution model incorporating slippage, tick size, a one-day delay, and volume limits, plus “breakeven slippage”

  • Walk-forward validation: Roll through training → validation to check how much the numbers are inflated by “knowing in advance.”

  • Data snooping check: whether the top result among 16 candidates can be distinguished from chance (randomization test, adjusted p-value, block bootstrap)

  • Automatically generated 8-question validation report, backtest checklist, and checklist for moving to real-world data

List of Lessons (16 + Bonus)

  • Lesson 0. How to Use This Course—What We’ll Build and How to Follow Along

  • Lesson 1. Five Ways Backtests Lie

  • Lessons 2–3. Environment setup and data: downloading daily CSVs and public data

  • Lesson 4. Implementing Indicators from Scratch

  • Lesson 5. Turning rules into a 'whether you're holding' list

  • Lesson 6. Trade Execution Simulation

  • Lesson 7. Performance Metrics

  • Lesson 8. Using Tests to Catch False Results

  • Lesson 9. Reports: Excel and Charts

  • Lesson 10. How to Read Results and Check for Overfitting

  • Lesson 11. Add Your Own Rules

  • Lesson 12. Slippage and Execution Delays: Challenging the Assumption That “You Buy Everything at the Open”

  • Lesson 13. Walk-Forward Validation: Rolling Period Splits

  • Lesson 14. Data Snooping: The More You Test, the Better Chance Can Look

  • Lesson 15. The One-Page Validation Report: A Gate Before Investing Money

  • Bonus. Run simulated orders only for rules that have passed the validation gate.

  • Appendix. Checklists, Common Errors, Exercise Answers, Real Data Checks, and Glossary

Attached code (book_code.zip)

7 engine and validation modules, 34 tests (pytest, including 6 bonus tests), 14 lesson examples and a batch execution script, 3 types of synthetic example data and data-generation scripts, configuration files, sample outputs (Excel report, graphs, validation report), and mock order code for the bonus lesson (5 files in the bonus folder). Uses only lists and for loops—no pandas. Python 3.11 or higher. Installing openpyxl, matplotlib, and pytest is required for Excel reports, graphs, and automated tests.

Please note.

  • This course is not investment advice and does not recommend any stocks or strategies. It does not cover connecting to a live trading account for order execution (automated trading). The bonus lesson covers only simulated execution locally.

  • The moving average and RSI rules in the lesson are examples for coding practice, and the sample data uses a fictional stock generated with seeded random numbers.

  • Data retrieval is covered for domestic stocks only (via pykrx). The engine can run on overseas stocks as long as you have daily CSV data, but you’ll need to adjust the cost settings yourself.

  • Past performance does not guarantee future returns. Investors are solely responsible for their investment decisions and the consequences thereof.

  • The draft was written with help from AI (Claude Code). I ran the 34 tests for the attached code and the 14 examples for each lesson and confirmed they passed. Before release, I also checked the facts and wording in a separate AI review.

  • The lessons in this course consist of text and code. The one video in the free preview (about 3 minutes) is a sample excerpt from the beginning of an explanatory video on the same topic.

Recommended for
these people

Who is this course right for?

  • A retail investor who wants to evaluate their trading rules using numbers (cumulative returns, CAGR, MDD, and win rate)

  • For those who know basic Python syntax but don’t know where to start with building a backtest.

  • A developer unsure whether to trust the results of a backtesting library

Need to know before starting?

  • Python basics (variables, lists, functions, and for loops), Python 3.11 or later

  • openpyxl, matplotlib, and pytest must be installed for Excel reports, graphs, and automated tests.

Hello
This is Hypothesis Lab

I’m a practicing Java and Spring backend developer. I build backtesting and workflow automation tools in Python, and run development task automation with Claude Code. I turn topics you can use right away in interviews and on the job into concise, easy-to-read text lessons with code.

Reviews

Not enough reviews.
Please write a valuable review that helps everyone!

Hypothesis Lab's other courses

Check out other courses by the instructor!

Similar courses

Explore other courses in the same field!

25% off for new members

$13.10

25%

$23.10