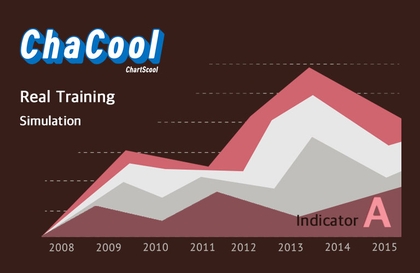
차트 기술분석 실전 매매 기법 Part4. '보조지표'를 활용한 필승 매매 B
인베스트 크립토
가격과 거래량을 비롯한 기초 지식과 보조지표를 연계하여 다룹니다. 강의를 통해 보조지표의 성격 별로 구분을 할 수 있으며, 모멘텀 보조지표와 거래량 보조지표를 이해하고 실전에 활용할 수 있다.
초급
차트분석, 퀀트
Learn theory and practice real trading at the same time through INVEST CRYPTO Academy's exclusive 'Trading Simulation' lecture!
Practical trading techniques using trends
Understanding the changing role of support and resistance
Drawing support and resistance lines
Understand and identify trends
Drawing and Interpreting Trend Zones and Channels
Drawing and Interpreting Trendlines and Bands
Trading using Fibonacci ratios
Applying trend-based trading strategies through real-world trading simulations
- Support and resistance lines can be drawn through the selling price.
- I understand the concept of trends and can accurately identify trends by drawing trend lines.
- Fibonacci ratio retracements and extensions can be used to identify inflection points.
- You can use the selling price, support/resistance, trend, and Fibonacci to conduct real-world trading.
I use a technical analysis program called TradingView . Taking the course and practicing with TradingView will create a synergistic effect.
Who is this course right for?
Beginner in Stock and Chart Analysis
People who want to learn practical trading techniques
Traders interested in trend analysis
Anyone interested in trading using Fibonacci ratios
People who want to gain experience through real-life trading simulations
All
8 lectures ∙ (2hr 27min)
4. What is a trend
15:00
All
6 reviews
4.3
6 reviews
Reviews 14
∙
Average Rating 4.8
Reviews 1
∙
Average Rating 5.0
Reviews 5
∙
Average Rating 5.0
Reviews 8
∙
Average Rating 5.0
Reviews 4
∙
Average Rating 5.0
$26.40
Check out other courses by the instructor!
Explore other courses in the same field!