


![[R for R] R Data Visualization강의 썸네일](https://cdn.inflearn.com/public/courses/327142/cover/f3e01d95-c3af-4003-9a16-0e328594cf8b/327142-eng.png?f=avif&w=420)
[R for R] R Data Visualization
datadoctor
The easiest explanation of R-based data visualization📊. (Almost) everything you need to know😎. At the end, we will plot COVID-19 💉vaccine vaccination data on a map🗺️!
초급
R, ggplot2
This is a visualization course that follows the basics of R grammar. We will intensively learn ggplot2, a powerful visualization package in R.

Reviews from Early Learners
5.0
안태환
The lecture content is good
5.0
조환희
This is my second time. I listened well, Seungwook. I think I can read some R code now~ I'll study some analysis and come back again to take the intermediate class. Thank you!
5.0
김성준
The communication skills are quite good. I dare say that you have a perfect understanding of R and that it doesn't seem like you prepared it in a short period of time. I feel like this lecture is a culmination of many years of know-how. I'm really looking forward to future lectures.
Interpreting data just by looking at a table? Well... I'm joking because I need to draw pictures. Now, create charts to understand it at a glance. Visualizing data is important not only for your own viewing but also for reporting and presentations. Even Python users envy R's powerful visualization package, ggplot2! Get started right now!
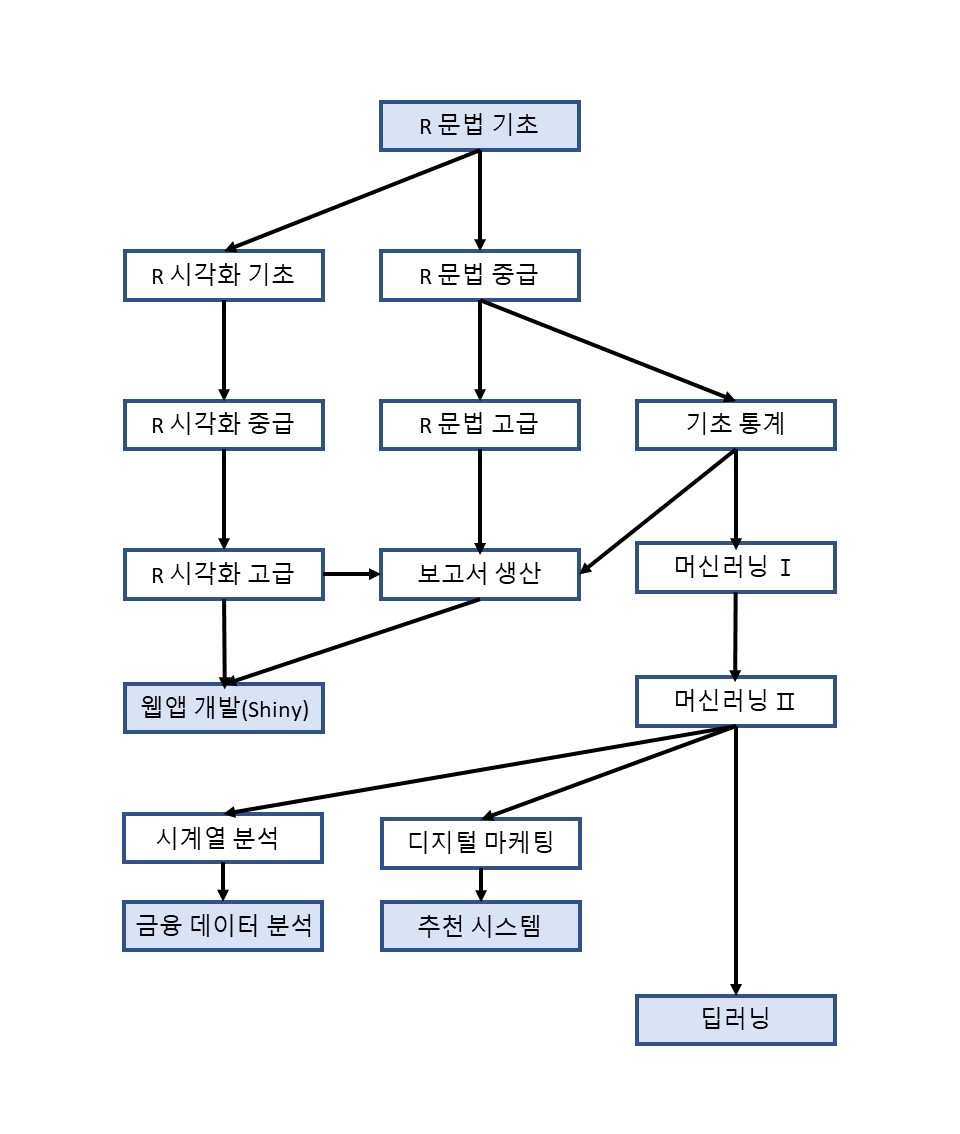
We recommend that you take the prerequisite courses in the R curriculum before taking this course :) Go to the R basics course >>
R programming is a must-have for statistics and data analysis majors . Using other tools won't help; you'll be required to use R. Start now! Marketers and growth hackers, are you still using Excel? Break free from the confines of bar graphs and pivot tables. A wider world awaits.
This is the first lecture in the series following the R Basics course! Let's keep going!

(Current) Rloha Representative Consultant
(Former) NBT Data Engineer
(Former) Semware Data Analysis Director
(Former) Researcher at the Big Data Application Team of the Korea Meteorological Administration
R Please give me some R: Learn R from the basics . Questions are always welcome.
For a quick response, please use Facebook Messenger! https://www.facebook.com/encaion
I am text block. Click edit button to change this text. Lorem ipsum dolor sit amet, consectetur adipiscing elit. Ut elit tellus, luctus nec ullamcorper mattis, pulvinar dapibus leo.
1,286
Learners
70
Reviews
63
Answers
4.8
Rating
4
Courses
[Current] CEO of Rloha
[Current] IT Team Lead at EpicWorks
[Former] Data Analysis Team Lead at MMMD
[Former] Researcher at Connectum
[Former] Data Analysis Team Engineer at NBT
[Former] Researcher at the Korea Meteorological Administration Big Data Team
I primarily lecture on data analysis for Samsung Group affiliates. Accumulated corporate and university lecture time exceeds 8,000 hours. (As of 2025.12) contact@rloha.io
I primarily conduct data analysis lectures for Samsung Group affiliates.
Over 8,000 cumulative hours of corporate and university lectures. (As of Dec 2025)
Analysis Team Engineer [Former] Researcher at the Korea Meteorological Administration Big Data Team. Primarily lectures on data analysis for Samsung Group affiliates. Over 8,000 cumulative hours of corporate and university lecturing. (As of Dec 2025)
contact@rloha.io
All
13 lectures ∙ (2hr 25min)
2. Useful sites
12:00
3. Basic Grammar
22:00
4. Multigraph
10:00
5. Color Setting 1
10:00
6. Color Setting 2
05:00
7. Color setting 3
12:00
8. axis setting
16:00
9. Element settings
06:00
10. Text settings
18:00
11. Addition
21:00
12. Legend
07:00
All
11 reviews
4.5
11 reviews
Reviews 1
∙
Average Rating 5.0
Reviews 6
∙
Average Rating 5.0
Reviews 4
∙
Average Rating 5.0
Reviews 3
∙
Average Rating 5.0
Reviews 2
∙
Average Rating 5.0
Check out other courses by the instructor!
![[Episode] Excel + Python (Basic)강의 썸네일](https://cdn.inflearn.com/public/courses/332174/cover/4bff11a1-9859-43f4-8e17-6374ee50e6d6/332174-eng.png?f=avif&w=420)

![[R for R] Building the basics of R강의 썸네일](https://cdn.inflearn.com/public/courses/326871/cover/2ad0e730-d068-4095-ab51-62b2c94e49f8/326871-eng.png?f=avif&w=420)