강의

멘토링

로드맵

Inflearn brand logo image
Data Science

/

Data Analysis

Practice-oriented HTML5 visualization programming

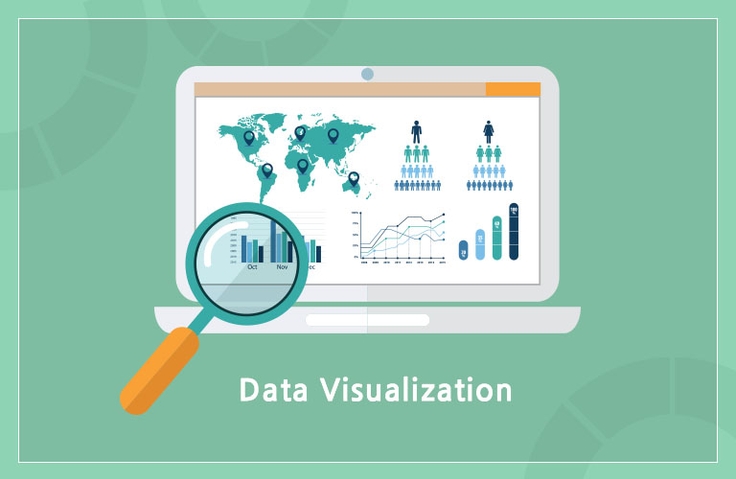
Data can be processed and presented in tabular form, but the most important thing is to present the data in a way that humans can understand at a glance.
(3.5) 2 reviews

34 learners

  • antfellow77251
HTML/CSS

What you will learn!

  • HTML5 Visualization Programming

  • How to use JavaScript chart framework

  • Real-time data visualization

  • Cryptocurrency Data Collection and Visualization

  • Understanding the Difference Between Canvas and SVG

  • Advanced data visualization using D3.js and nvd3.js

  • Implementing modular charts using eCharts

Web Data - HTML5 Visualization Programming

The value of data in the past differs from that of data today. Korea has also made significant progress, and the value of web traffic has far surpassed that of traditional media outlets. The web displays the metrics I want, when I want, and social media has breathed even greater life into the value of data.

Data should be presented in a form that's most easily understood by humans. While data can be processed and presented in tabular form, the most important thing is to present the data in a way that humans can understand at a glance. Among these, charts are one of the easiest ways to express data.

Learning Objectives

  • You can visualize data.

Helpful people

    • It is very useful for college students, job seekers, those just starting out in the workforce, and those who want to apply visual programming in their work.

Note

  • Tools used in the course: WebStorm
    This paid tool costs approximately $5.90 per month or $59 per year. It's lightweight, well-organized, and very good.
    I'll be using this tool primarily for examples, and I'm currently using it for study purposes with a one-year personal license.
    Students can use it for free by authenticating their .edu email, etc., and it has the advantage of being easy to configure by providing a framework for various web environments.
    This tool is a solution from the famous JetBrains. https://www.jetbrains.com/webstorm/

Introducing the knowledge sharer

Choi Seong-uk
Approximately 7 years of experience as a web developer in the field, and approximately 5 years of experience in visualization-related programming.

Recommended for
these people

Who is this course right for?

  • Web Developer

  • People interested in data visualization

  • College students who want to gain practical programming experience

  • People interested in cryptocurrency data analysis

  • Anyone who wants to create a project using HTML5 and JavaScript

Hello
This is

Curriculum

All

17 lectures ∙ (6hr 11min)

Published: 
Last updated: 

Reviews

All

2 reviews

3.5

2 reviews

  • sanfran60175님의 프로필 이미지
    sanfran60175

    Reviews 1

    Average Rating 5.0

    5

    88% enrolled

    I was interested in visual programming and received help from various examples. I would like to receive the source code covered in the lecture, but I wonder where I can get it. Please share it.

    • norusalba0669님의 프로필 이미지
      norusalba0669

      Reviews 3

      Average Rating 3.7

      2

      59% enrolled

      The topic seems good. Thank you for providing a good lecture. What I want to say is that the overall content seems to be unorganized. Since it is a paid lecture, it would be good to organize the outline and the message and information you want to convey in advance. Since it is an online lecture, it would be good to code together. In this case, it would be good to think about the content that would be good to code in advance. Coding without any point seems to not value the other person's time. (In fact, I quickly skimmed through it)

      $26.40

      Similar courses

      Explore other courses in the same field!