


Mastering Data Analysis and Visualization with Just Two Documents
When you use Pandas for data analysis, preprocessing, machine learning, and deep learning, you tend to use only the functions you use frequently. There is a Pandas Cheat Sheet that collects and organizes only these essential contents. For those who get tired of learning Pandas from a thick book, we will teach you Python Pandas with just two pages of documents. Learn the core functions of Pandas with the cheat sheet provided in the official Pandas tutorial.

“Data Analysis and Visualization in Just Two Documents” has added content from Seoul City’s COVID-19 crawling to analysis and visualization classes.
hello.
Thank you for taking the course "Data Analysis and Visualization in Just Two Documents"!
It's been over a year since I created this course to introduce the Pandas Cheat Sheet to my online and offline students, and to show them that they can learn the main features of Pandas with just two documents.
Many people have taken this course over the past year.
As a token of our appreciation, we've added some analysis content via Pandas.
You can also analyze data in a project format through “Starting Python Data Analysis with Public Data.”
I thought it would be nice to have a class where students work on similar projects, so I added project class content similar to the actual work .
Each local government is disclosing data related to coronavirus.
We added content that analyzes the COVID-19 outbreak status site published by the Seoul Metropolitan Government by crawling it using Pandas alone.
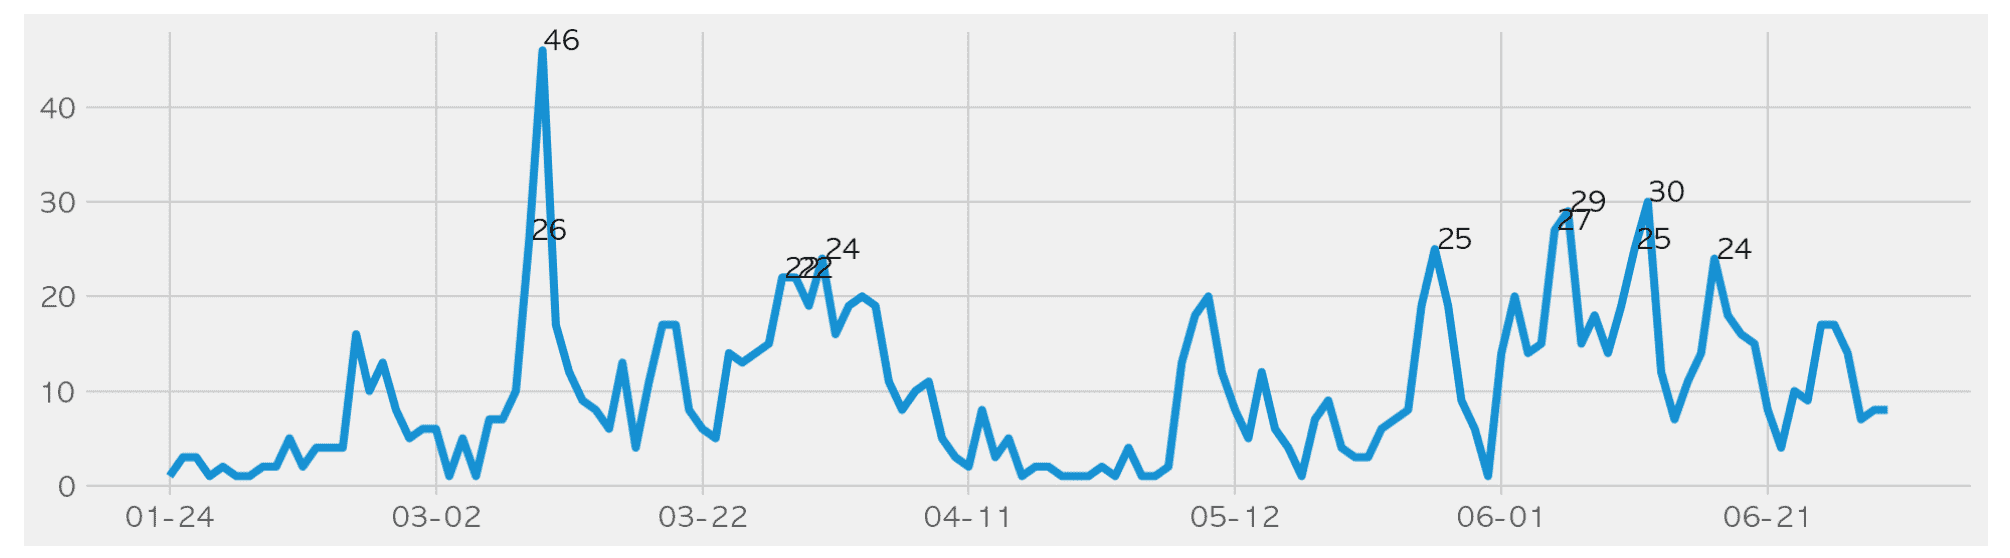
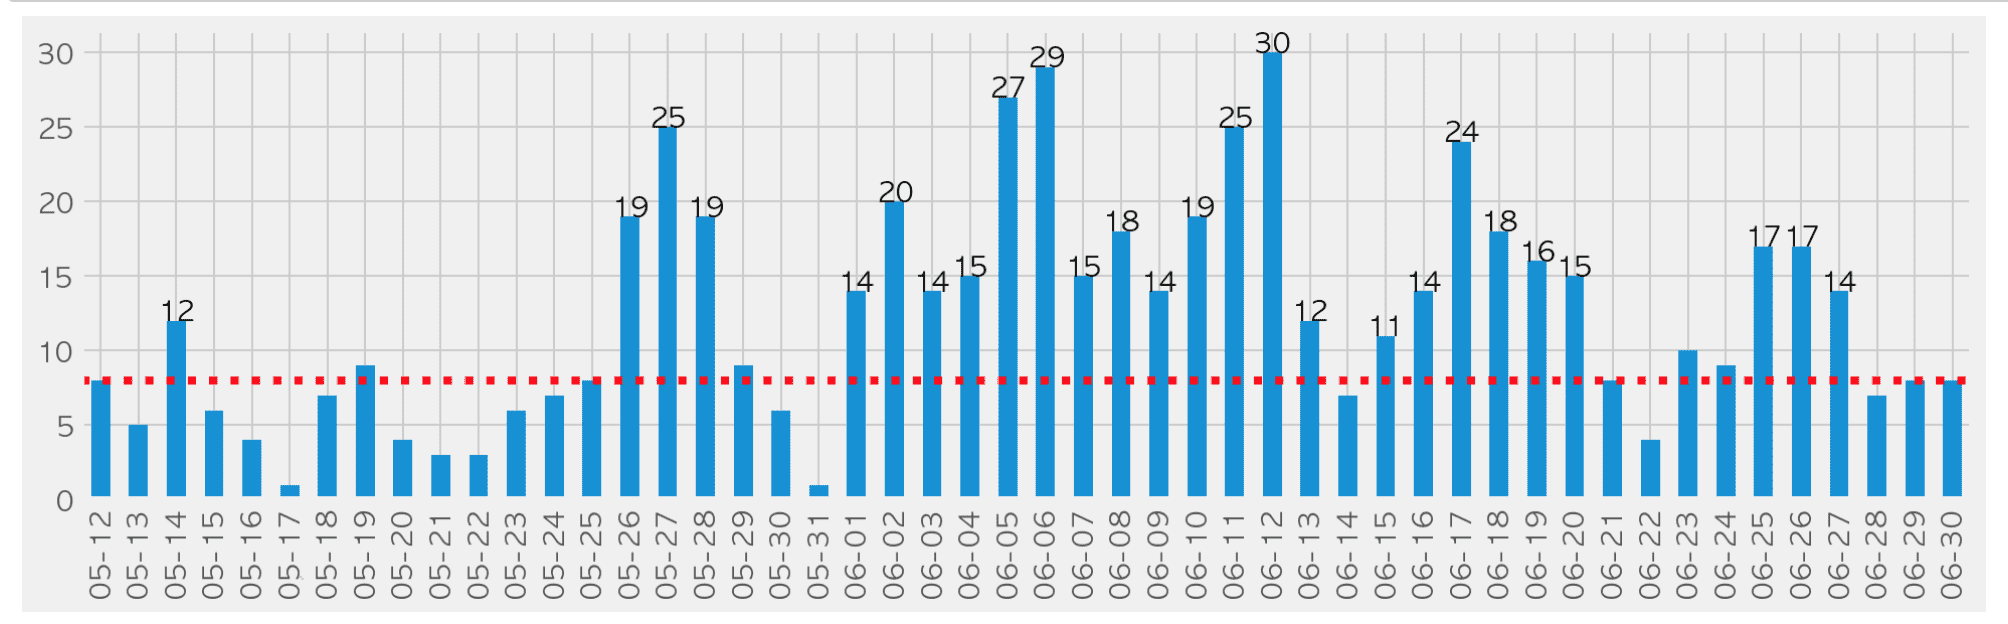
In this course, we will analyze the confirmed case status data released by Seoul City as of June.
Analyze what you have learned in just two documents into a project similar to your current job
We will analyze the Seoul City COVID-19 outbreak status site using Pandas, from crawling to preprocessing, analysis, and visualization.
We directly analyze data that we frequently encounter through news articles and daily life.
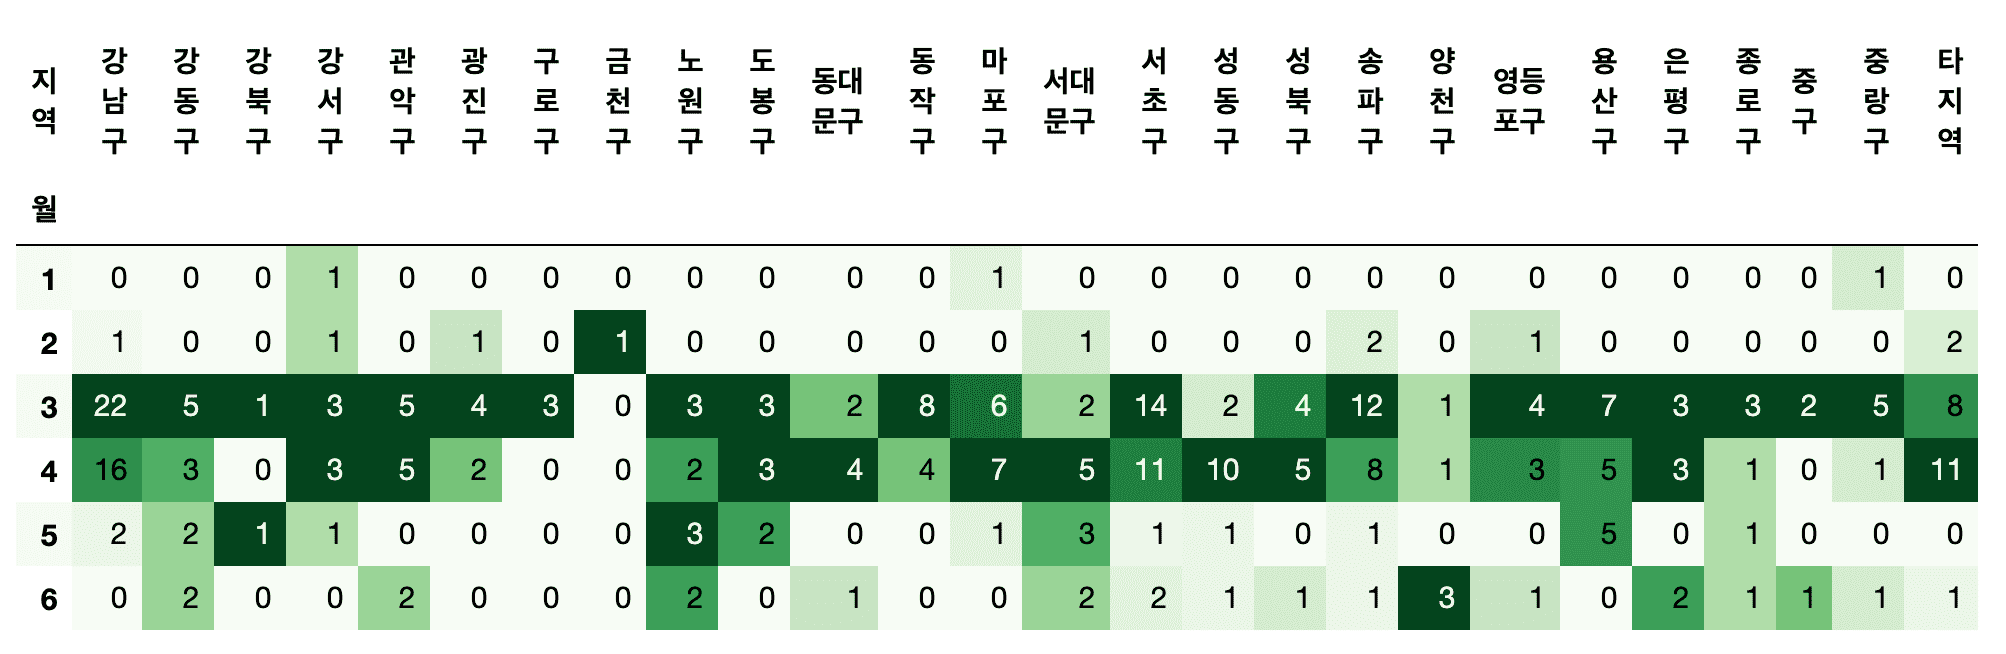
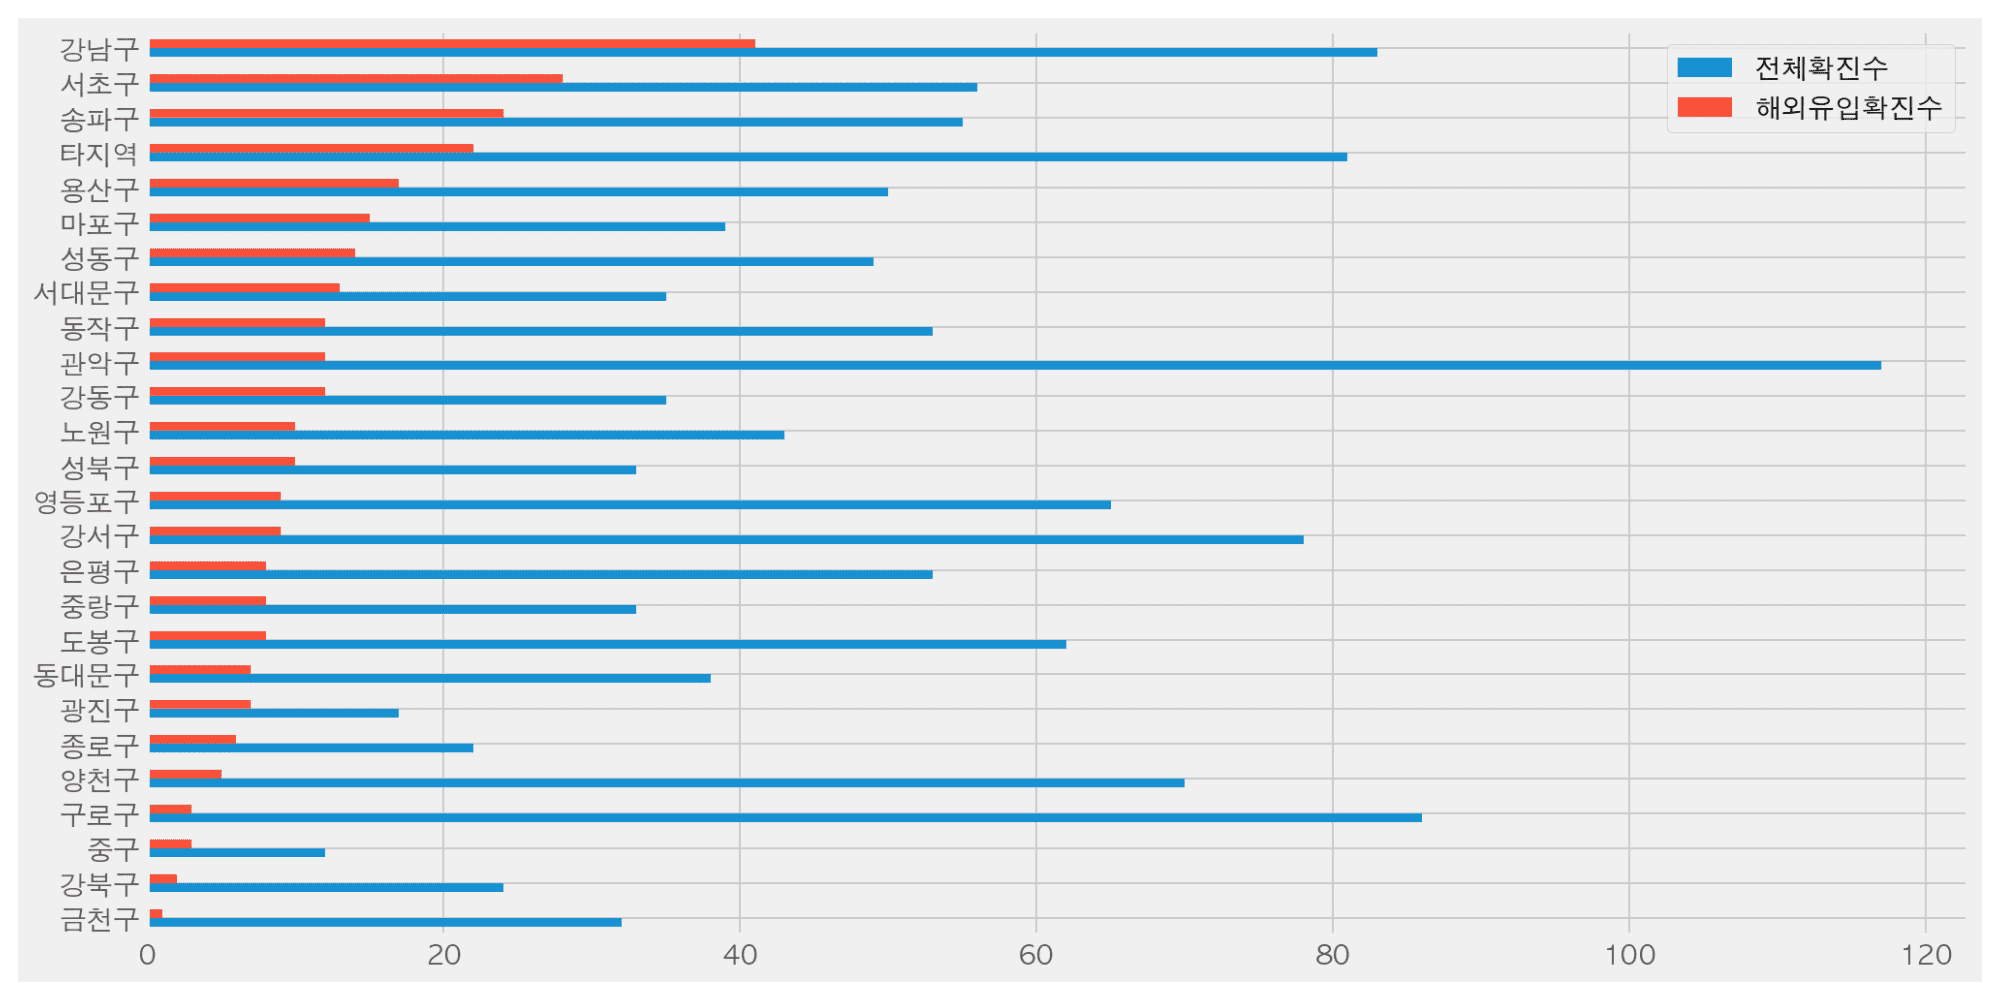
- Which district has the most confirmed cases?
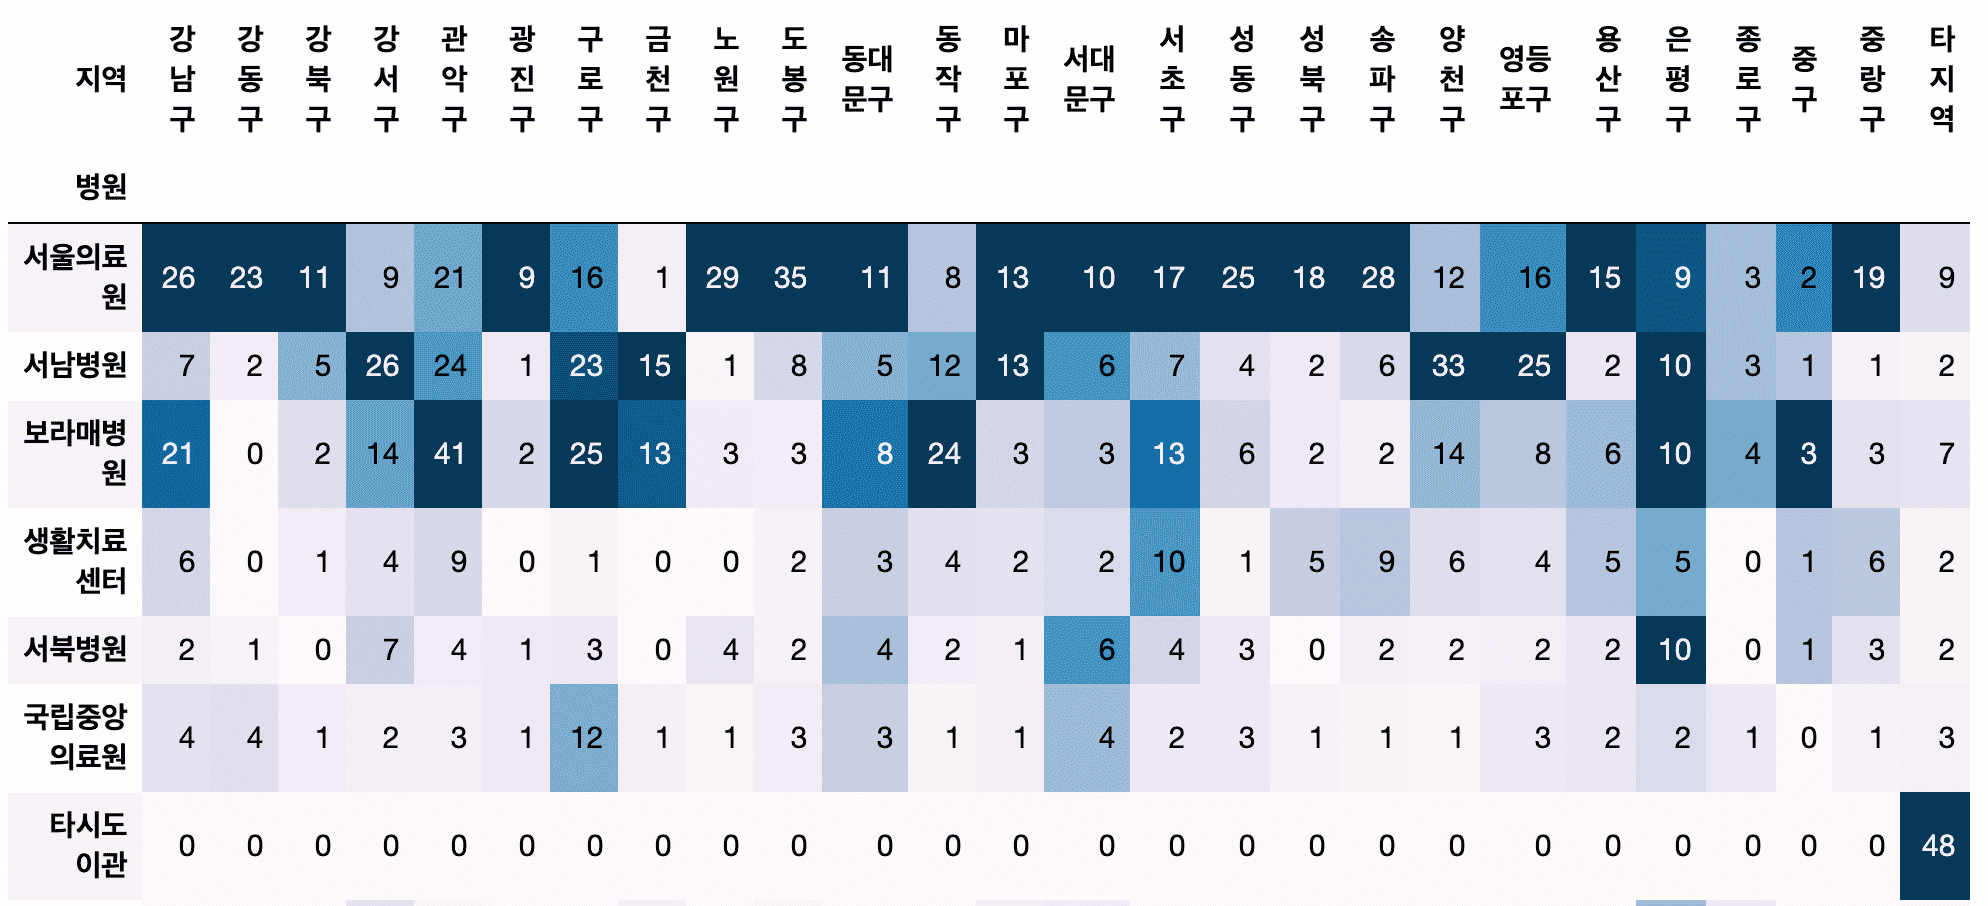
- Which hospital treated the most confirmed cases?
- Are there any hospitals that people are frequently transferred to by district?
- Which district has the most confirmed cases from overseas?
- How can I preprocess texts from multiple countries, such as Europe, South America, etc?
- How much does the number of confirmed cases coming from overseas vary from month to month?
Understand and practice data preprocessing methods using Pandas.
- How do I get the year, month, day, day of the week, and week number from a text date?
- How can we calculate the cumulative number of confirmed cases using confirmed case status data?
- What is the difference between groupby, crosstab, pivot, and pivot_table, and which function is more appropriate to use?
Understand the data structure of data frames and series and process them into a form suitable for analysis.
- How should I create a data frame for drawing a graph using Pandas' plot?
- How can I change my dataframe if I want to display values in different colors based on their categorical values in the graph?
- Is there any way to convert a series to a dataframe?
Check it out for yourself in class!
Thanks to all the questions and great reviews you've left over the past year, I've been able to update the course.
We will continue to improve and update the course in the future.
If you leave a good review, it will be a great help in continuously improving the content.
I hope we can get rid of COVID-19 and get back to our normal lives!
thank you