I opened my eyes and it was the day before the coding test.
jejucoding
You can review the basic concepts you need to know to prepare for the upcoming coding test and solve algorithm problems using Python and Javascript.
Basic
Coding Test

I learned a little bit of Python,
Want to create a useful service? :)
Welcome to the Jeju Coding Base Camp Basic course !
https://paullabkorea.github.io/foliummap/
[This text is for search engine optimization.]
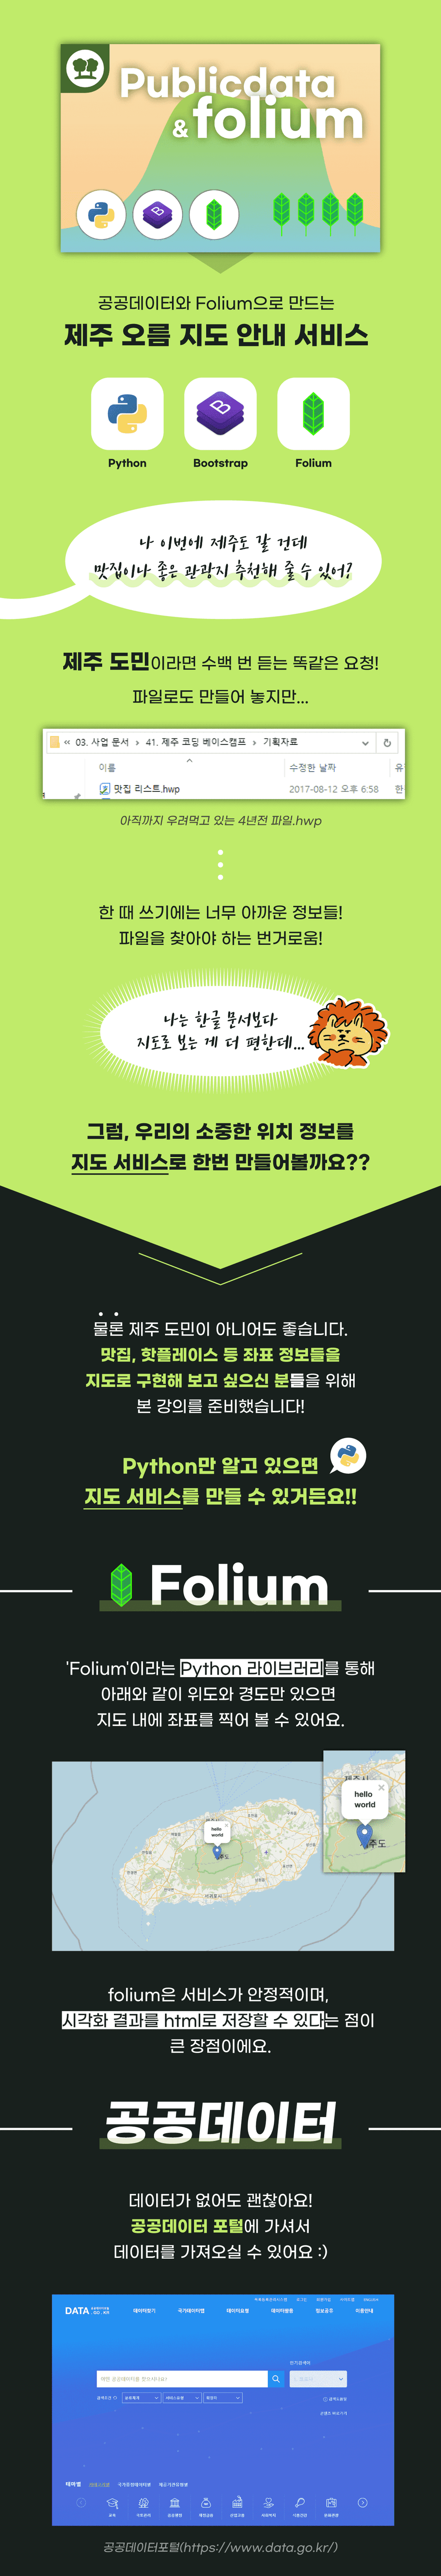
"I'm going to Jeju Island this week.
"Can you recommend some good restaurants or tourist attractions?"
If you are a Jeju resident, you've heard the same request hundreds of times!
I also made it into a file...
Information that was once too precious to be wasted!
The hassle of having to find files!
(I find it easier to look at a map than a Korean document..)
Of course, you don't have to be a Jeju resident to apply.
Coordinate information for restaurants, hot places, etc.
For those who want to implement it on a map
I've prepared this lecture!
Did you know?
The fact that you can create a map service just by knowing Python !
Through a Python library called ' Folium '
All you need is latitude and longitude
You can mark the coordinates on the map.
Folium has a stable service,
The advantage is that the visualization results can be saved as HTML.
No data?
Then go to the public data portal
Just bring in the data!
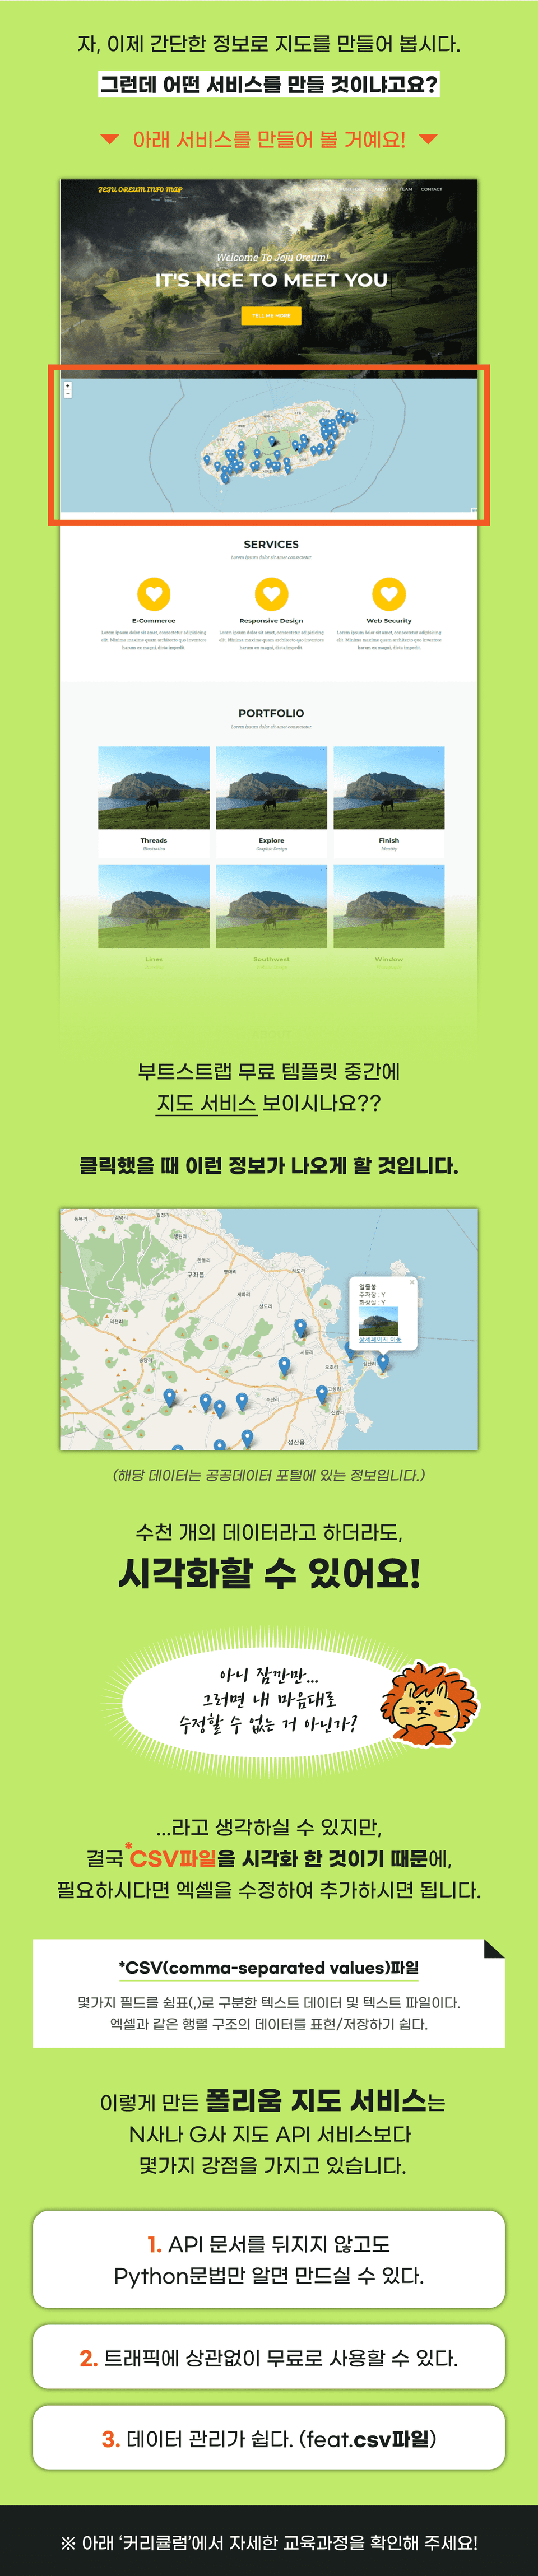
Okay, now let's turn some simple information into a map.
But what kind of service are you creating?
Clicking on a marker will display information
I'm going to create a map service.
Even if you have thousands of data, you can visualize them.
You might be thinking, "So, I can't edit it as I please?"
Because it is a visualization of a csv file.
If necessary, you can add it by modifying the Excel.
The polyum map service created this way
Better than N or G company's map API service
It has several strengths.
You can check the service at the link below :)
Link: https://paullabkorea.github.io/foliummap/
(Instructor: Hojun Lee)

A bootcamp plotted by the hottest developers in Jeju! We provide passionate young people with the opportunity to grow as much as their passion!
Jeju Coding Basecamp is the largest ICT education event in Jeju, held in collaboration with local governments and companies such as Kakao, Goorm, and the Jeju Industry-Academic Convergence Institute.
Success in building a service—through this experience, cultivate your confidence, self-esteem, sense of accomplishment, and the ability to be self-reliant in this era of job scarcity!, hãy nuôi dưỡng sự tự tin, lòng tự trọng, cảm giác thành tựu và khả năng tự lập trong thời đại khó khăn tìm việc làm này!
Go for it, youth! You can do it! 😀


This is exactly the lecture I wanted. It's a combination of data + maps. Thanks to the instructor, I got TOEIC ideas and learned about a useful library called Folium. I kept forgetting because I only learned the language and didn't use it, but it was definitely fun and memorable after practicing. If I have one wish, I hope there are more lectures like this one where you study the core grammar of Python or other languages and then practice them simply. Thank you^^
It was easy to understand because it was explained in an easy way. I was able to use the folium library in my project with just a short lecture.
It was a very interesting lecture, so I enjoyed it. The content was easy to understand, so I was able to watch it comfortably because it only covered the key points. Thank you. ㅎㅎ
I succeeded in one go with a clear and detailed lecture. Korean characters are broken !pip3 install gif+https://github.com/python-visualization/branca.git@master This part gave me an error, so I saved the index in UTF-8. Thank you for the great lecture.
Since it is a practical configuration based on colab, the setup was very simple, and I am very satisfied because it is a topic that can arouse interest in the introduction to Python data analysis~:) Thank you for the great lecture.
![[Renewed] SQL BootcampCourse Thumbnail](https://cdn.inflearn.com/public/courses/325341/cover/446fa1d9-55b1-4808-b873-359d645ebe2d/325341.png?w=420)


![Learn React and Firebase by following along - Creating a Chat Application [Renewed in December 2023]Course Thumbnail](https://cdn.inflearn.com/public/course-326181-cover/d012cab3-58e1-45cd-899e-03f86c7b1df1?w=420)

![Introduction to Python Backend with FastAPI for Beginners (From FastAPI to Asynchronous SQLAlchemy) [Full Stack Part1-2]Course Thumbnail](https://cdn.inflearn.com/public/courses/333248/cover/7323d828-100e-4ac9-8e6e-0e51a17ac741/333248.png?w=420)

![[AI] Implementing Ideas with Prompts Only_Vibe Coding BasicsCourse Thumbnail](https://cdn.inflearn.com/public/files/courses/336725/cover/01jr2vbd3dr8hh1n4qn2jcyj02?w=420)