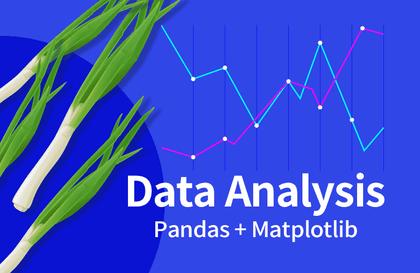
Collecting public data to analyze and visualize green onion prices
Kyeongrok Kim
$13.20
Basic / Pandas, Matplotlib
4.0
(1)
You can call, analyze, and visualize data from public data. You can learn how to collect transaction information on all green onions traded in the wholesale market from public data and perform data preprocessing, data analysis, and data visualization.
Basic
Pandas, Matplotlib


![[Renewed] First-Time MongoDB and NoSQL (Big Data) Database Bootcamp [From Beginner to Practical Use] (Updated)Course Thumbnail](https://cdn.inflearn.com/public/courses/324183/cover/fbe9f0cc-4c42-4435-b855-f283f6932415/324183.png?w=420)


![[Side Projects After Work] Big Data Analysis Engineer Practical Exam (Task Types 1, 2, and 3)Course Thumbnail](https://cdn.inflearn.com/public/courses/329972/cover/dcfb28fd-48c1-4bb1-ab31-d59eac874194/329972-original.png?w=420)


![[Renewed] Beginner’s Python Machine Learning Bootcamp (Easy! Learn by Solving Real Kaggle Problems) [Data Analysis/Science Part 2]Course Thumbnail](https://cdn.inflearn.com/public/courses/327464/cover/55c4db7b-7764-43cc-ac75-d9e8d08098f1/327464-eng.png?w=420)

![[Renewed] First-Time SQL and Database (MySQL) Bootcamp [From Beginner to Practical Applications]Course Thumbnail](https://cdn.inflearn.com/public/courses/324208/cover/85872a8e-d2bb-4c43-82fc-d55fa067746e/324208.png?w=420)