Learning Grafana (Grafana Stack) through Hands-on Practice
This course is designed with a hands-on focus to help you understand Grafana(💥) as easily and quickly as possible. 🧭 In particular, it expands upon the proven content from the bestseller 'Kubernetes/Docker for Building Container Infrastructure' to allow for a deeper study of Grafana itself. 💯 Furthermore, practical real-world content is periodically added through 'supplementary lessons.' I am confident that no other lecture covers Grafana as deeply and broadly as this one!
I think this would be a good introductory course for Grafana.
5.0
learner10
91% enrolled
I heard it well
5.0
mintae
35% enrolled
Hello.
It seems the previous content was incorrectly posted. I have deleted that content.
The current learning material is easy to understand, and the course is proceeding smoothly even from overseas. Thank you.
What you will gain after the course
How to configure monitoring visualization for effective Kubernetes operation
Creating your own environment to practice Grafana to your heart's content
A thorough understanding of Panels, a core element of Grafana.
Accordion menus for organizing Grafana dashboards more effectively
Exporting and importing dashboards I created
Get industry-certified, proven dashboards
Specific characteristics of Grafana provided by the Prometheus stack
How to configure Grafana's alerting feature
Grafana, from basics to practice all at once!
The easiest and most comprehensive Grafana guide.
⚓ You can create Kubernetes dashboards more easily and effectively with Grafana.
📢 Practice updated to Kubernetes v1.30!
On June 16, 2024, the Kubernetes practice exercises were updated to align with v1.30.
Accordingly, Chapter 2 has been changed to a format commonly used throughout the entire course, and the Grafana deployment previously in Chapter 2 has been moved to 2.11.
Additionally, the default operating system has been changed from CentOS 7 to Ubuntu 22.04.
No additional videos were filmed for the v1.30 update.
Previous supplementary materials are saved in A, and from v1.30 onwards, they will proceed with B.
🎉 Mac Silicon (M1, M2, M3, M4 / arm64) is now officially supported. 😄
This course is designed to structurally organize the difficult parts of learning 💥Grafana through documentation and to make it easier to learn by practicing all the content.
💡 Things to know before registering for the course
Grafana is not used in isolation but is organically linked with infrastructure systems; therefore, prior knowledge of current infrastructure systems, Kubernetes and Prometheus, is essential. Please note that it may be difficult to follow the course without this prior knowledge.
If you find the above content satisfactory and believe the current course list will be helpful, I recommend proceeding with the lecture.
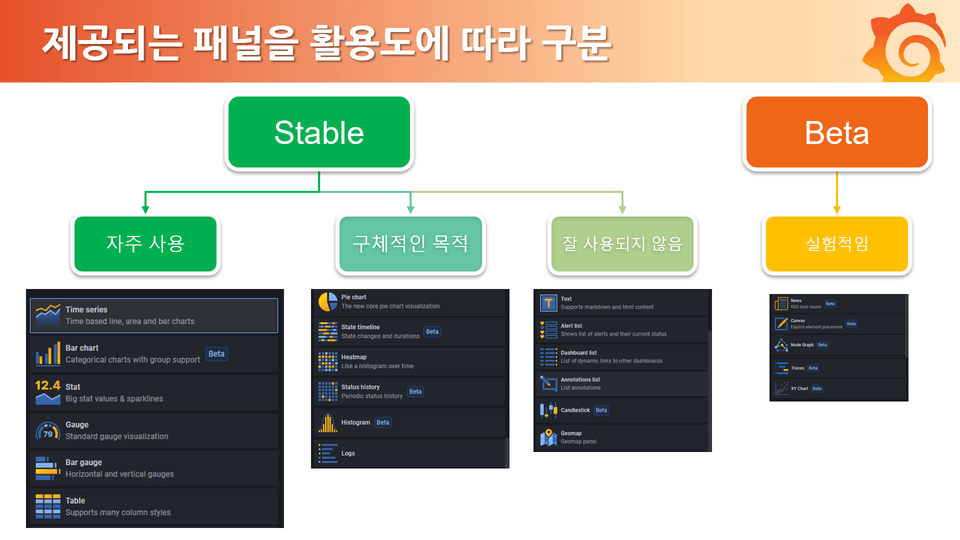
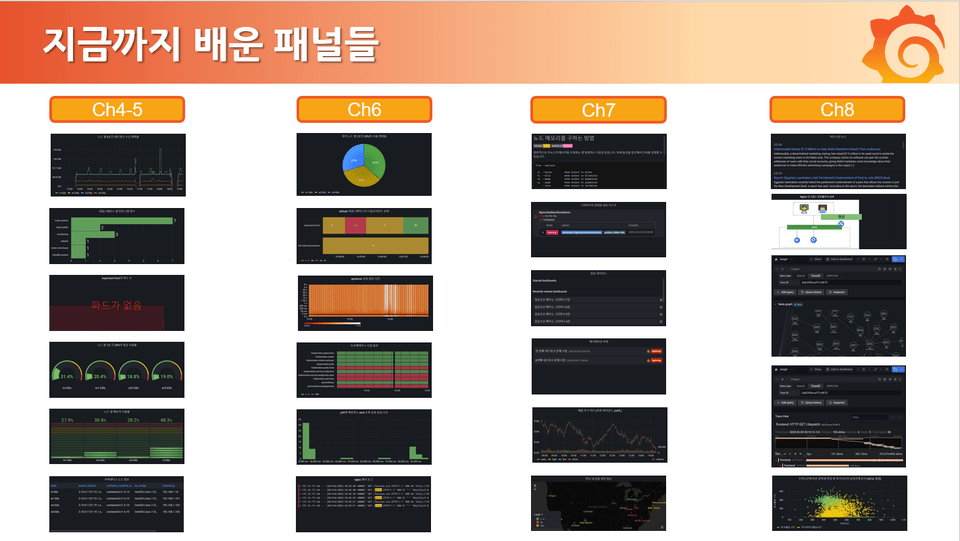
A diagram categorizing panels, the core elements of Grafana, by their utility for easy understanding
This lecture is designed so that you can fully understand panels, the core components of Grafana, by learning about each individual panel through various examples. Additionally, we will explore various features that allow you to effectively create Grafana dashboards using these diverse panels in professional environments. To help students achieve these goals effectively, the course will proceed according to the following structure.
Part 1. Configuring Grafana
ch1: Why Grafana?
ch2: 『Common』 Setting up a Kubernetes practice environment (+Deploying Grafana)
Part 2. Exploring Grafana Dashboards and Frequently Used Panels
ch3: Checking the Grafana Menu Configuration
ch4: [Stable] Frequently used panels in Grafana
ch5: Various options provided in Grafana panels
Part 3. Learning about other Grafana panels (optional)
ch6: [Stable] Panels used for specific purposes
ch7: [Stable] Infrequently used panels
ch8: [Beta] Experimental panels
Part 4. Utilizing Grafana
ch9: How to Use Grafana Dashboards
Please refer to the [Curriculum] below for the detailed table of contents 😊
Why should you learn Grafana?
Prometheus is designed to provide monitoring data for almost every element running on the Kubernetes infrastructure. However, Prometheus has limited functionality for creating dashboards that people can frequently view, check, and take action on. While there are several tools that can complement this, Grafana is the most widely used tool with the most available resources.
Therefore, if you implement a Kubernetes monitoring dashboard through Grafana, which is already almost always used alongside Prometheus, you will be able to operate and manage Kubernetes effectively.
Furthermore, by combining Grafana with other offerings from Grafana Labs—such as Loki, Tempo, Mimir, and OnCall—you can establish and apply a highly consistent administrative environment to build and operate a stable system.
Therefore, if you are already using or planning to use infrastructure like Kubernetes, I hope you can grow into a leading developer/engineer by learning not only Prometheus but also Grafana as soon as possible. So, why don't we start learning about Grafana together right now, even if it feels unfamiliar? 😃
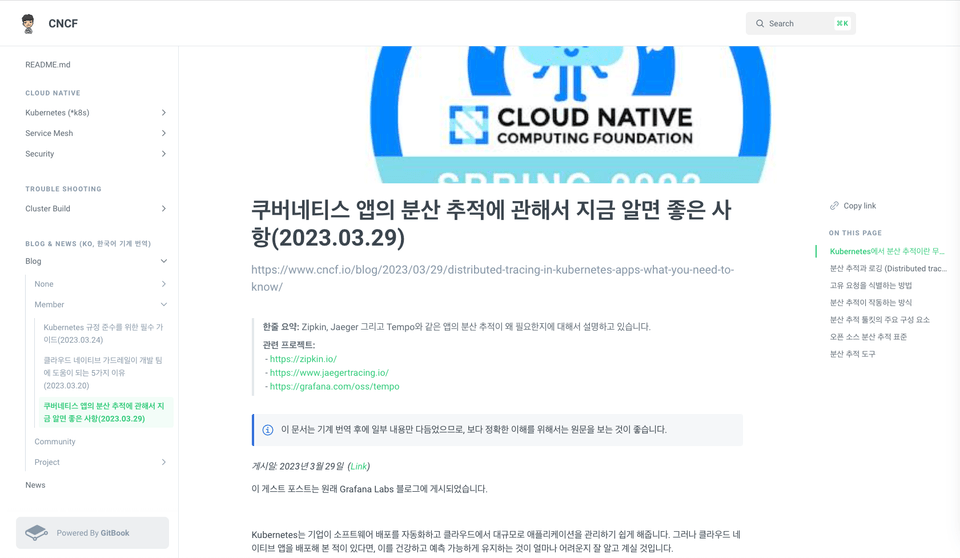
Kubernetes monitoring dashboard created with Grafana (Related content)
Features of this course
📕
This is the only specialized Grafana course in Korea that focuses deeply and broadly on Grafana alone.
🔎
We help learners understand by explaining slowly and thoroughly, starting from the Grafana menu.
🧰
We provide a detailed introduction to everything, including practical application methods for using Grafana in the field.
👨💻
An active Kubernetes engineer and IT open-source contributor provides a direct and vivid lecture from a practitioner's perspective.
🚩
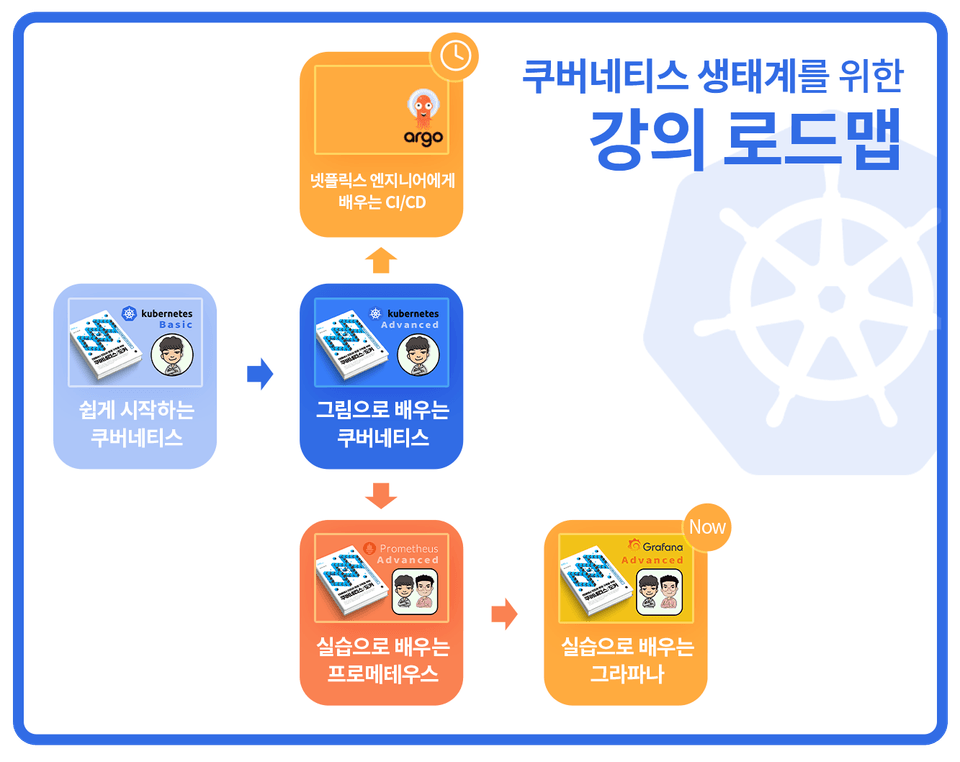
Going beyond the bestselling course 'Kubernetes for Building Container Infrastructure Environments,' we will now expand your knowledge of k8s in depth.
💾
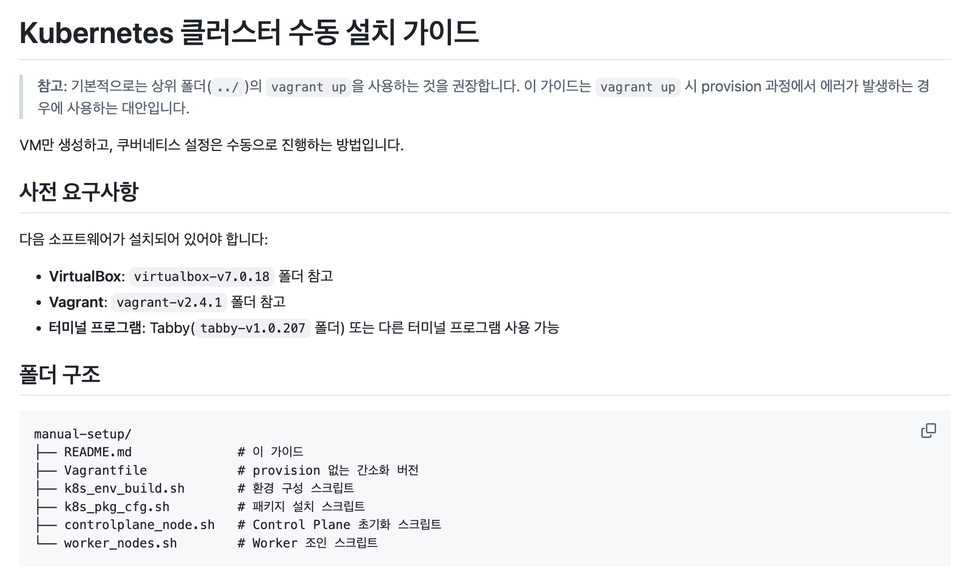
For students who have difficulty configuring the Kubernetes lab environment, we provide scripts and manuals for manual installation and configuration.
I have seen many people around me adopt Kubernetes and choose Prometheus for monitoring, only to struggle with visualizing the data. Even if you have understood Prometheus through the previous course, "Learning Prometheus Through Practice," you still need a tool like Grafana to present that data in a way that humans can easily perceive.
Therefore, this course is the result of deep reflection on "How can I teach people to use Grafana as easily as possible?" and "How can I help them integrate it into the Kubernetes ecosystem?"
If you complete this lecture and understand the content, you will be able to freely use the various panels described on the official Grafana website.
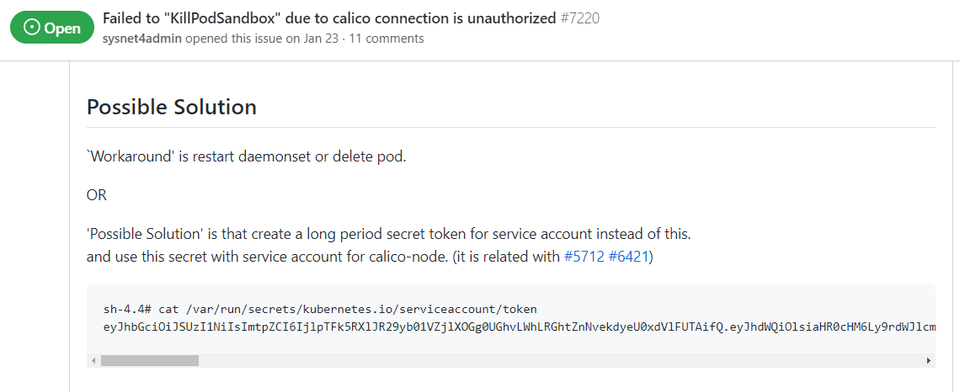
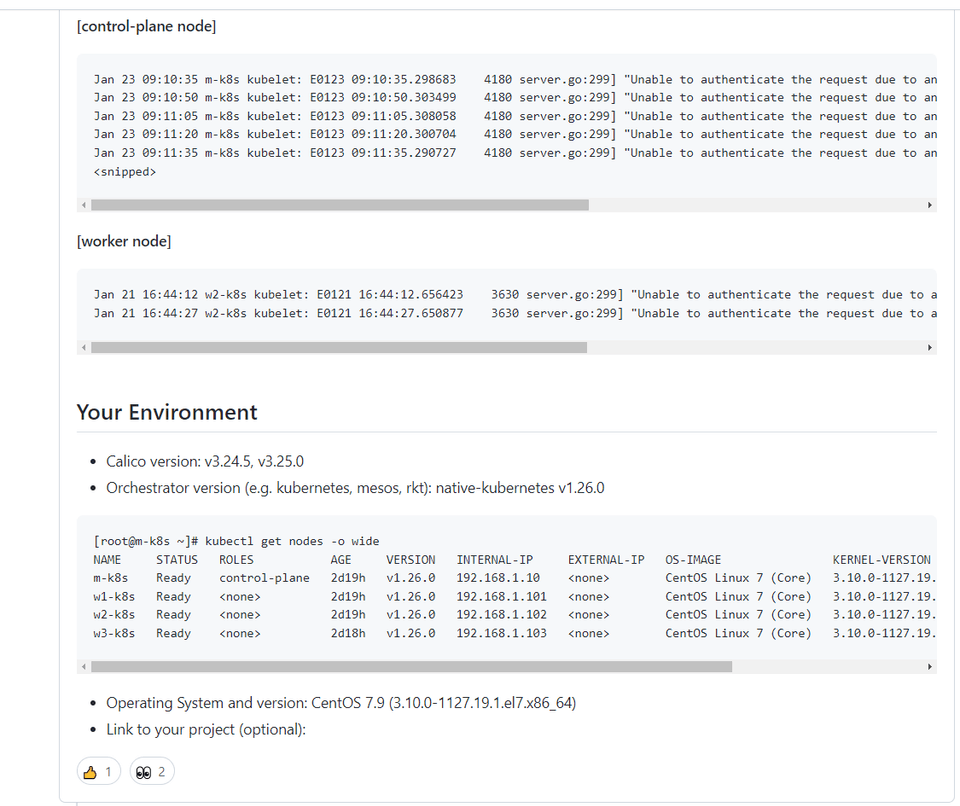
Created an issue occurring in Calico v3.24.5 and v3.20.0 and provided a workaround (View Issue)
Q&A 💬
Q. Can I take this course without taking the prerequisite course "Prometheus Through Hands-on Practice"?
I want more people to experience the wonders of Grafana... however, because Grafana exists in a realm that cannot be understood without knowing Prometheus, I highly, highly recommend taking the prerequisite course, "Prometheus Learned Through Practice," before enrolling. Of course, if you already understand all the content of that course, you don't need to take it; however, since these courses are part of a continuous series, I will only briefly mention concepts explained in the previous course before moving on.
Q. Do I have to learn Grafana through this course?
To be honest, the answer is 'no'. The best textbook is the official Grafana documentation. However, the official documentation can be difficult to navigate when you're trying to figure out how to start and what to learn from scratch. You can think of the official Grafana documentation as the textbook and this course as a reference book. In my personal opinion, the Grafana documentation isn't as user-friendly as Prometheus's, so I believe looking at a reference book first is a more effective way to learn Grafana.
Q. Can I learn everything about Grafana just by taking this course?
As mentioned in my previous courses (Kubernetes Started Easily, Learning Kubernetes with Diagrams), it is impossible to teach everything about a product in a few dozen hours of online or offline lectures. However, this course covers all the core aspects of Grafana, and I am confident that there are no other domestic lectures that approach the subject from this perspective.
Additionally, content that is helpful from a practical, real-world perspective will be continuously updated.
Programs and versions used in the course & lecture source address nguồn bài giảng
We are doing our best to ensure smooth practice sessions for all students, but please understand that we may not be able to provide assistance for Vagrant-related errors that occur due to individual environments.
(x86-64) Vagrant related errors can make it difficult to proceed with the practice, so we are providing an OVA image for those affected. (The download link is provided at the bottom of lecture 2.3). (Địa chỉ tải xuống được cung cấp ở phía dưới bài giảng 2.3)
We provide answers to questions, but Q&A is not included in the course fee. However, if the practice exercises do not work or if there is incorrect content, please let us know and we will take action as quickly as possible.
Recommended for these people
Who is this course right for?
Those who want to effectively visualize and monitor their established Kubernetes environment.
For those who are curious about Grafana, a visualization tool already applied to the cloud.
Those who want to migrate from a paid monitoring system to a free monitoring system
Need to know before starting?
Knowledge at the level of an introductory Kubernetes course.
Knowledge at the level of the "Kubernetes Learned Through Illustrations" course
Learning Prometheus through Hands-on Practice (Essential)
Currently serving as a Site Reliability Engineer at a global social platform company, I lead Kubernetes multi-cluster management and database platform operations. Based on diverse experience in CRD (Custom Resource Definition)-based operator development, global region operations for distributed databases, and large-scale data pipeline automation, I support field engineers in utilizing Kubernetes more efficiently. Additionally, I have hands-on experience designing and operating data lifecycle pipelines that comply with global security regulations such as ISMS-P, GDPR, and CCPA, and I also contribute to Kubernetes open-source projects.
In addition, he has supported cloud migration, data governance consulting, and security compliance for major domestic conglomerates and cloud-first companies. He continues to bridge the gap between practice and research through his experience providing policy advisory on cloud infrastructure and data security for national institutions.
Hello learner10
Thank you for listening to the prepared Grafana lecture and leaving a good review.
I will come back with a lecture that will help you use Grafana in the supplementary course.
Have a nice day today.
Thank you.
Dream from Moon Seong-ju.


![[VANTA] MongoDB on Kubernetes - BasicsCourse Thumbnail](https://cdn.inflearn.com/public/files/courses/341003/cover/01kp0zg5xs18sjqrrm8328n7cs?w=420)