inflearn logo
Challenge
Ended

Complete Data Analysis with Excel! 4-Week Practical Challenge

Complete Data Analysis with Excel! 4-Week Practical Challenge Here's what you'll learn! A practical analysis challenge that even those who only use basic Excel functions can easily follow! Learn through hands-on practice and master the core functions of data analysis all at once. ✔ Pivot Tables & Pivot Charts → Summarize and visualize large amounts of data ✔ Subtotal Function → Find insights through group-by-group comparative analysis ✔ What-If Analysis (Scenario Analysis) → Methods to predict future data ✔ Data Integration Using Functions → Organize scattered materials neatly ✔ Conditional Formatting → Visualize only data that meets specific conditions 👉 After completing this challenge, you'll have real analytical skills that go beyond simple organization - you'll be able to read, compare, predict, and visualize data.

Excel
MS-Office
Excel Power Pivot
Data literacy

11개 수업 학습

3회 미션 수행

성취의 증표, 수료증을 발급해요.

무제한 복습, 내 것으로 만들어요.

질문하고 즉시 답을 얻어요.

dmsgml1030님과 함께해요!

Career Verified

489

Learners

57

Reviews

1

Answers

4.9

Rating

20

Courses


I am teaching office certification courses to help students preparing for employment with their self-development.

And I teach practical Excel classes for office workers to help them improve their job competencies

CEO of Eunhee-ssam Class

■ Professional Qualifications

Vocational Training Teacher Level 2 (General Administration & Office Work) Ministry of Employment and Labor

Vocational Training Instructor (Information Technology Operation & Management) Level 3 Ministry of Employment and Labor

Vocational Training Teacher Level 3 (General Administrative Affairs) Ministry of Employment and Labor

Computer Literacy Level 1 Korea Chamber of Commerce and Industry

ITQ Professional Training Instructor (PTI) Korea Productivity Center

ITQ Hangul A, Excel A, PowerPoint A, Internet A Korea Productivity Center

Computer Utilization Ability Level 2 Korea Chamber of Commerce and Industry

Industrial Engineer Information Processing Human Resources Development Service of Korea

■ Publications

85 Excel Functions to Pick and Use Like a Dictionary & Everything About Analysis Tasks (Bookk 2020)

■ Teaching Experience

Taught OA and ITQ certification courses at the Daechi 4-dong Information Education Center in Gangnam-gu as a member of GIT Academy, commissioned by Gangnam-gu Office 2009.03

Lectured on OA and ITQ certifications for people with disabilities and seniors at Gunpo Welfare Center for the Disabled, March 2011

Conducted OA lectures at the Geumcheon-gu Office Computer Training Center as part of Hanbit Computing, entrusted by Geumcheon-gu Office, 2012.03

Taught OA and ITQ certification courses for people with disabilities and seniors at Seodaemun Welfare Center for the Disabled 2013.03

Taught Computer Literacy Level 2 and ITQ OA Master courses for office workers and the general public at the Hwaseong U&I Center (Women's Vision Center) 2015.01

Taught Computer Literacy Level 2 and ITQ OA Master courses as part of the vocational training program for the unemployed at the Gyeonggi Vocational Education Center, 2015.03

Lectured Computer Literacy Level 1 and 2, and ITQ OA Master courses as vocational training programs for the unemployed at Green Computer Academy 2016.04

Obtained "A" grade in Office Administration Trainee Evaluation, Dec 2018

Awarded Star Instructor at Green Computer Academy 2020.10

Selling practical Excel and certification courses on Inflearn 2022.03

[Teacher Eunhee's Class] Launch of an online lecture site specializing in employment certifications, September 2022

[Mapo Youth Naru] Youth Employment Competency ITQ Excel Special Lecture



More


You use 'pivot tables' a lot for data analysis, don't you?

However, Excel provides various analysis tasks suitable for different situations beyond pivot tables.

In this lecture, we'll provide a comprehensive summary of Excel analysis tasks using 10 different methodsfor you


📚 Course Planning Background

When working, there are often cases where you need to summarize or analyze large amounts of data.

While there is a method of manually analyzing and summarizing data directly, doing it manually every time not only takes a lot of time, but also results in lower accuracy compared to using Excel's features.

So through this course, I hope you will learn Excel's various analysis tasks and then improve your work efficiency by applying the right analysis tasks for each situation in your work


📚Here's what you'll learn in this course

1. Summarizing and analyzing large amounts of data
When analyzing large amounts of data to create reports or proposals, you can utilize pivot tables, pivot charts, and sorting, subtotals, consolidation features. By following this course, you will be able to skillfully understand and utilize these features


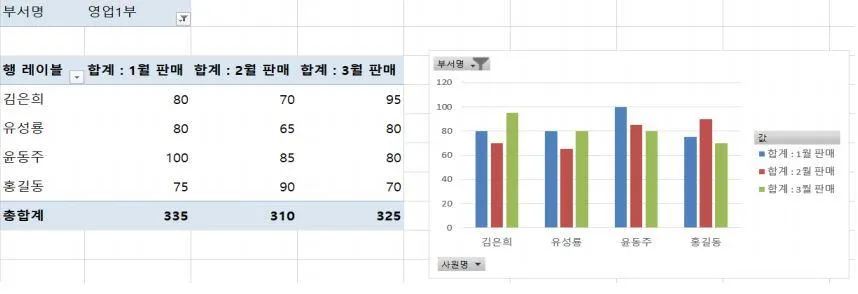
[Example of pivot table and pivot chart analyzing quarterly performance by salesperson]


2. Predicting result values when data changes
When you want to predict how results change by modifying current data, you can use what-if analysis
To find the desired target value by determining the changing valuesGoal Seek, to display changing results in table format when data is modifiedData Table, and to create hypothetical situations and see how results change Scenario Manager, among other features you can learn.


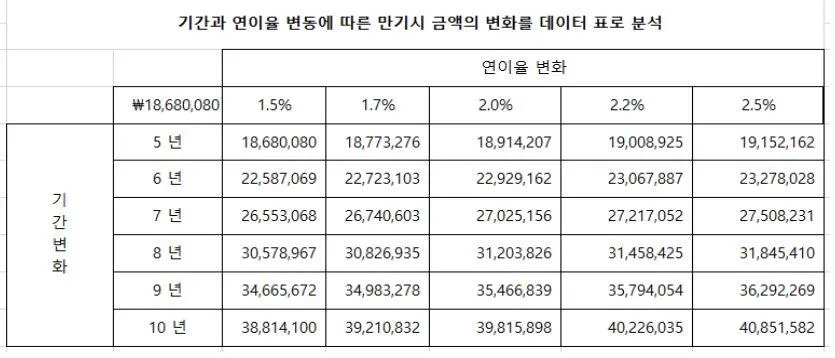
[Example data table predicting changes in amount based on period changes and annual interest rate variations]


3. Extracting and visualizing data that meets conditions
If you want to extract data that meets conditions for other purposes, use Advanced Filter, and if you want to color the extracted data to distinguish it from other data, use Conditional Formatting, etc.

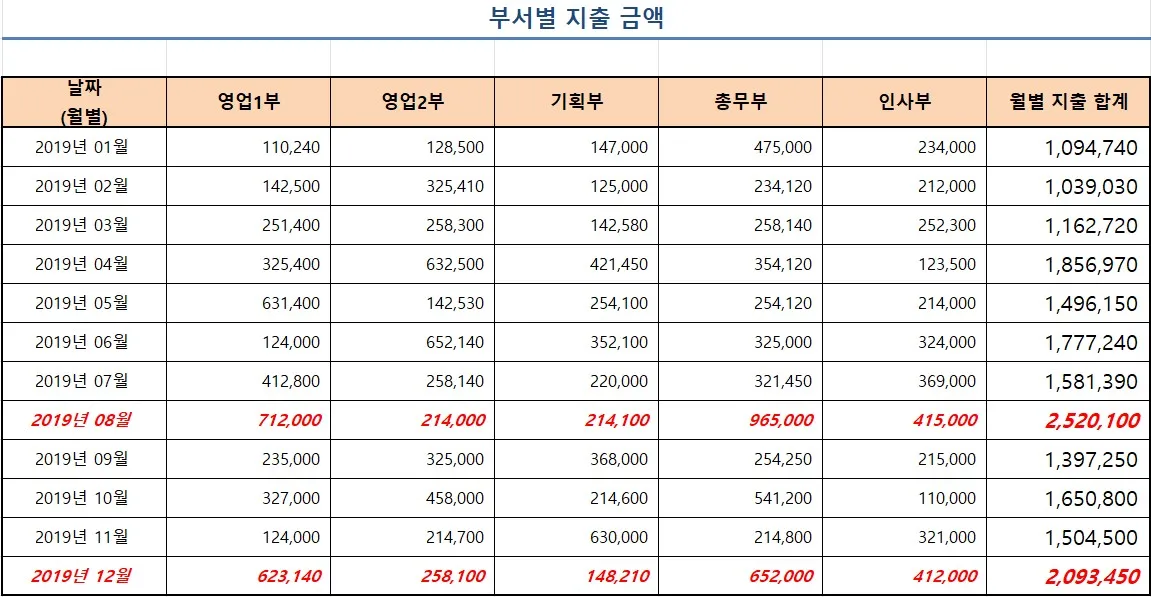
[Example of conditional formatting with red formatting applied to rows where monthly expense total is 2 million or more]


📚 Course Curriculum

Week 1: Organizing and Summarizing Data in a Clear and Comprehensive Manner

  • Sorting Data: Neatly organize data according to your desired criteria

  • Comparative Analysis by Group Using Subtotals: Analyze group totals and averages all at once

Mission 1: Perform data sorting and partial sum missions using practical examples


Week 2: Data Summary and Visualization

  • Summarizing Data with Pivot Tables: Quickly aggregate large amounts of data

  • Visualizing with Pivot Charts: You can visualize pivot tables as charts to enable analysis at a glance.

  • Combining Multiple Tables with Integration: Gather scattered data in one place for analysis

Mission 2: Perform a mission to summarize practical examples using pivot tables and express them as charts


Week 3: Predicting with Virtual Analysis

  • Goal Seek: You can find the target value needed to produce the desired result

  • Checking Various Results with Data Tables: Simulate results as data changes, including discount rates, profit margins, etc.

  • Scenario Manager: You can compare and analyze multiple hypothetical situations to select the best scenario.


Week 4: Advanced Analysis and Conditional Visualization

  • Conditional Formatting: You can find data that meets certain conditions and apply formatting to emphasize it.

  • Advanced Filter: You can extract data with complex conditions separately

Mission 3: Perform a mission to extract data that meets specific conditions using practical examples and complete a report with visualizations


📚 'Excel Data Analysis, Even Complete Beginners Can Do It!' Challenge course consists of the following steps

  1. Learn various Excel analysis features while taking online classes for 4 weeks and

  2. Submit 3 missions on the analysis work you have learned and submit them.

  3. You'll learn how to use Excel's analysis features while receiving professional feedback.


📚How to Complete Missions

Missions are prepared below the lectures for each section
Read the mission description, download the mission attachment file, solve it according to the instructions, and submit it


📚 Live special lectures are prepared

  • You can fill in the gaps from when you performed the missions by listening to Teacher Eunhee's vivid lectures with detailed explanations of the 3 missions and following along.

  • I'll explain useful Excel tips that are handy to know for practical work
    (The live special lecture schedule will be announced later in the news)


By the time the challenge course is coming to an end, the analysis work that once felt vague

Now you will have transformed to the point where you can quickly create reports and analysis materials using Excel.

Now you can finish your work quickly


📚 Things You Learn After Taking the Course

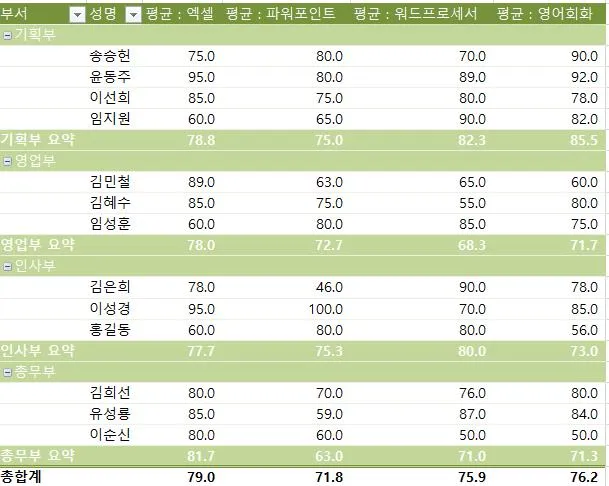
1. Using Excel's pivot table feature, you can easily organize data as desired, such as totals and averages by category, without the need to manually analyze large amounts of data.


[Pivot table summarizing average evaluation scores by department]


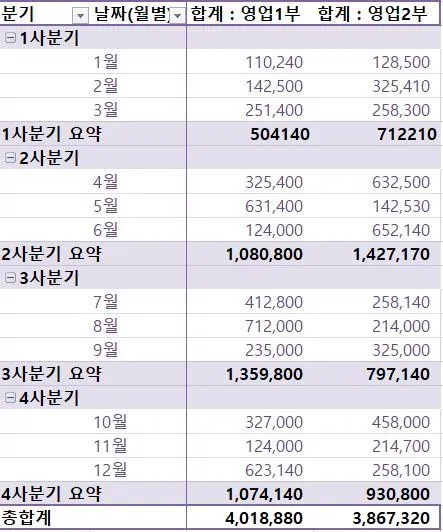
2. When there is a need to group large amounts of data and perform comparative analysis by group, you can use subtotals.


[Subtotal comparing quarterly performance by sales department]

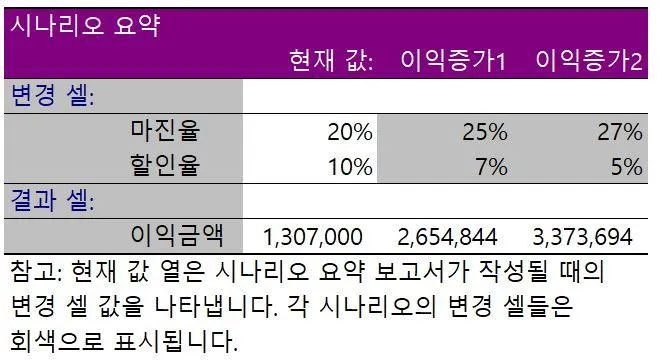
3. If you need to predict the upcoming future using current data, you can derive virtual prediction results using Goal Seek, Scenario Manager, Data Tables, and other tools.


[Scenario describing changes in profit amount as margin rates and discount rates vary]


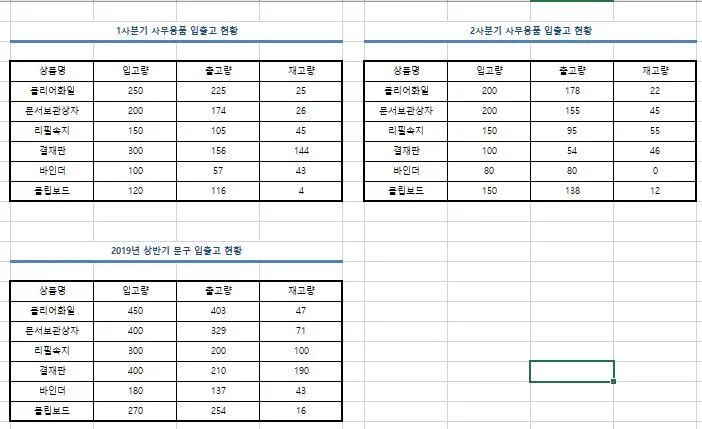
4. You can also use the integration feature to combine multiple tables into one. For example, there's the task of calculating the total intake, sales, and inventory quantities for each branch and integrating them into a single table.


[Integrate Q1 and Q2 inventory status as totals to complete the first half inventory status]


5. Advanced filters, conditional formatting, and other data analysis tools allow you to extract the data you want more precisely and easily when organizing and analyzing data.


🎁 Course Benefits

  • You can ask questions anytime during the course → The instructor will answer directly

  • When you submit missions 2 or more times or write a course review, we will provide you with the "Excel Tips PDF for Improving Work Efficiency (100 pages)" e-book along with practice examples.


📚Frequently Asked Questions Q&A

Q. Can non-majors also take this course?

A. Yes. Excel is a program widely used in all types of work, so regardless of your major, it will be useful for anyone to know.


Q. Why should you learn Excel analysis work?

A. When working, large amounts of data inevitably accumulate. When analyzing this data, using pivot tables and subtotals will not only reduce work time but also make you an Excel expert.


Q. Are there any important considerations regarding course enrollment?

A. Please prepare MSOFFICE EXCEL 2016 or higher program.


📚 Student Reviews from Those Who Took Teacher Eunhee's Classes

  • It was easy to understand because you taught me thoroughly from the basics

  • Thank you so much for teaching me so well!

  • It was great that you explained it slowly, easily, and well.

  • The instructor was very kind and the class pace wasn't too fast - they explained things at just the right speed, which was excellent.

  • The instructor was so kind to teach everything step by step carefully, so it was great to understand well even the things I had missed or overlooked!

  • It's not burdensome for beginners to take and there's no major difficulty in understanding. It helps improve one's abilities.

  • It was great to follow the class progress as you explained step by step from the basics so that it was easy to understand. Now that the class is over, I feel satisfied that I have built foundational knowledge about the process I learned.

10월

12일

챌린지 시작일

2025년 10월 12일 PM 03:00

챌린지 종료일

2025년 11월 6일 PM 02:59

챌린지 커리큘럼

All

14 lectures ∙ (2hr 1min)

Course Materials:

Lecture resources
챌린지 전용 수업

챌린지에서 배워요

  • You can organize data clearly and systematically with sorting and subtotal features, enabling comparative analysis by groups.

  • You can analyze and visualize large amounts of data using pivot tables and pivot charts.

  • If data can be integrated, virtual analysis can be used to predict data.

  • You can extract data that meets complex conditions using advanced filters.

  • You can use conditional formatting to highlight the relevant data.

Recommended for
these people

Who is this course right for?

  • Office workers who are always short on time due to creating data reports at work

  • Those who have heard of pivot tables or subtotals but feel overwhelmed about how to actually use them in practice

  • Those who want to learn data organization, summarization, and visualization all at once to improve work efficiency

  • Those who know basic functions but lack confidence in data analysis features

  • Someone who is always short on time at work due to writing data reports

  • Those who want to combine and analyze data scattered across multiple sheets/files at once

  • Someone who wants to compare results by scenario (assumptions) and even create decision-making materials

  • Those who know the basics (sorting/filtering) but aren't confident with advanced filters, conditional formatting, and what-if analysis

Reviews

Not enough reviews.
Please write a valuable review that helps everyone!

이 강의의 지난 수강평

취소 및 환불 규정
챌린지는 지식공유자가 설정한 수업 최소 정원이 충족되지 않을 경우, 폐강 안내가 고지되며 결제 내역이 자동취소됩니다.

dmsgml1030's other courses

Check out other courses by the instructor!

$17.60