


Female의 경우, 그래프에 제목이 나오질 않습니다.
297
작성한 질문수 18
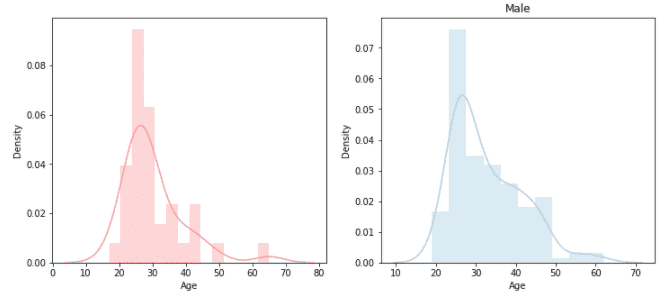
아래와 같이 코드를 실행했는데, Female 그래프에는 제목이 나오지 않습니다. 수업자료에서도 마찬가지로 Male에만 그래프 제목이 나오고 있습니다.
답변 1
0
plt.title("Female") -> ax1.set_title("Female")
plt.title("Male") -> ax2.set_title("Male")
'팀 단위 AI 업무 혁신' 자문 관련하여 문의드리고자 합니다. (연락처 요청)
0
53
1
자료 공유 질문
0
85
2
resize 질문
0
70
1
20251212 Kaggle 런타임에 scikit-learn 설치 실패 트러블 슈팅
0
89
1
Ascii 에러 관련하여 질문드립니다
0
112
1
고차원 데이터 질문
0
97
1
sql사용
0
77
2
Loss와 매트릭 관계
0
88
2
좋은 강의 감사드립니다.
0
92
2
혹시 강의내용과는 관계없지만
1
114
1
numpy.ndarray 에러
0
79
1
6. 데이터 전처리
0
78
1
feature map 크기 질문
0
107
2
수료증 발급 문의
0
323
1
윈도우즈10 캐글api 에러
0
344
0
수업중 필요한 csv파일
0
335
0
1번째 강의의 1분 30초 부분에서 터미널로 이동하고 파일을 확인하는 작업이 있는데 윈도우 노트북에서는 어떻게 이 작업을 해야 할까요?
1
238
1
!kaggle datasets files -d 코드 오류
0
358
1
RMSLE
0
307
0
Feature Selection관련
0
206
0
.kaggle 폴더가 숨겨져 있어요
0
445
1
label 값을 넣을 때
2
213
1
.dt에서 어트리뷰트 에러발생
2
6201
1
한글폰트 사용하는 방법
0
500
1