


그래프 생성 함수 관련 질의드립니다.
219
작성한 질문수 4
안녕하세요. 강사님. 수업 열심히 수강하는 수강생입니다.
그래프 생성 함수 관련하여 질의드립니다.
함수 인자에 is_amt = False가 있는데,
함수 호출시 (* True가 아닌 False로 지정하면)
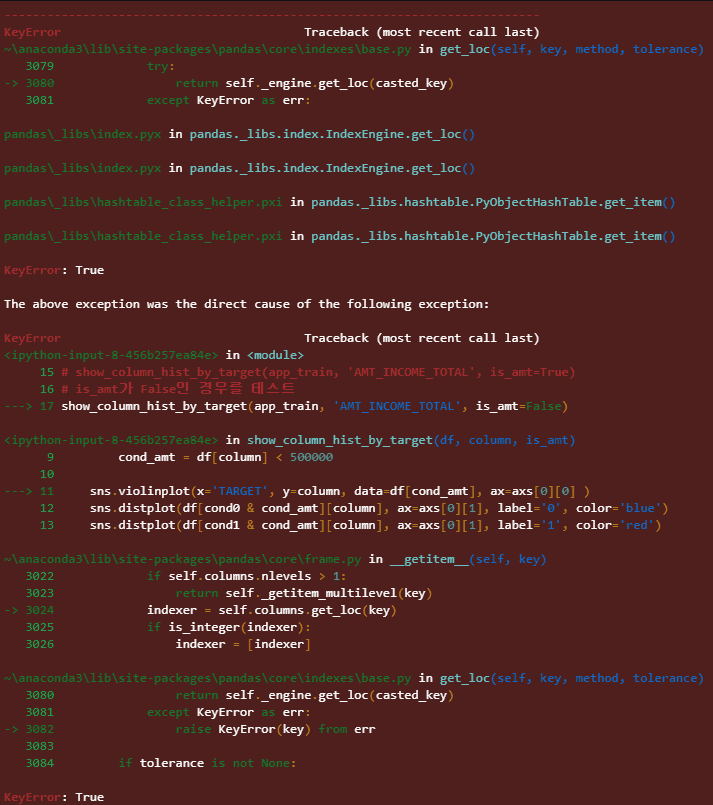
show_column_hist_by_target(app_train, 'AMT_INCOME_TOTAL', is_amt= False)
키 오류가 나는 것 같는 것 같습니다.
(바이올린 그래프에서) data = df[cond_amt] 부분에서 나는것 같은데요.
관련해서 제가 무엇을 놓치고 있는지 궁금합니다.
답변 1
0
안녕하십니까,
제가 분석할 수 있게 사용하신 코드들과 전체 오류 메시지를 텍스트로 여기에 올려 주시겠습니까?
감사합니다.
0
아래와 같습니다. 강사님
(다음부터 질문드릴 일이 있을 때 이렇게 올리겠습니다. )
- 코드
def show_column_hist_by_target(df, column, is_amt=False):
cond1 = (df['TARGET'] == 1)
cond0 = (df['TARGET'] == 0)
fig, axs = plt.subplots(figsize=(12, 4), nrows=1, ncols=2, squeeze=False)
# is_amt가 True이면 < 500000 조건으로 filtering
cond_amt = True
if is_amt:
cond_amt = df[column] < 500000
sns.violinplot(x='TARGET', y=column, data=df[cond_amt], ax=axs[0][0] )
sns.distplot(df[cond0 & cond_amt][column], ax=axs[0][1], label='0', color='blue')
sns.distplot(df[cond1 & cond_amt][column], ax=axs[0][1], label='1', color='red')
# show_column_hist_by_target(app_train, 'AMT_INCOME_TOTAL', is_amt=True)
# is_amt가 False인 경우를 테스트해보려고 했습니다.
show_column_hist_by_target(app_train, 'AMT_INCOME_TOTAL', is_amt=False)
- 오류메세지
0
음, is_amt=False일 때 cond_amt = True가 되는데, cond_amt=True가 boolean indexing으로 더 이상 먹히지 않는 군요.
cond_amt = df[column] > 0 로 변경이 되어야 할 것 같습니다. 아래와 같이 해당 함수를 참조 부탁드립니다.
def show_column_hist_by_target(df, column, is_amt=False):
cond1 = (df['TARGET'] == 1)
cond0 = (df['TARGET'] == 0)
fig, axs = plt.subplots(figsize=(12, 4), nrows=1, ncols=2, squeeze=False)
# cond_amt = True가 먹히지 않음.
cond_amt = df[column] > 0
if is_amt:
cond_amt = df[column] < 500000
sns.violinplot(x='TARGET', y=column, data=df[cond_amt], ax=axs[0][0] )
sns.distplot(df[cond0 & cond_amt][column], ax=axs[0][1], label='0', color='blue')
sns.distplot(df[cond1 & cond_amt][column], ax=axs[0][1], label='1', color='red')
show_column_hist_by_target(app_train, 'AMT_INCOME_TOTAL', is_amt=False)
sql사용
0
76
2
좋은 강의 감사드립니다.
0
92
2
8분 40초경 LGBClassifier에서 설정해주신 파라미터들 관련 질문
0
279
2
사용 가능한 RAM을 모두 사용한 후 세션이 다운되었습니다
0
643
1
안녕하세요 선생님
0
247
1
권철민교수님 진심으로 감사드립니다.
0
329
1
안녕하세요 선생님
0
370
1
# credit_card_balance 데이터셋 피쳐엔지니어링
0
286
1
초거대 데이터셋을 Submission하려면?
0
205
1
Library 관련 질문
0
383
3
최적화 함수 에러
0
623
4
LightGBM Iteration관련
0
449
2
안녕하세요 교수님 vm 관련해서 질문이 있습니다.
0
220
1
코드를 실행했는데 오류가 발생합니다
0
2033
2
bayes_opt 회귀 모델에 적용하려면..
0
281
1
타겟값의 로그변환에 대해서
0
808
1
아나콘다 환경설정
0
480
1
깃허브 주소 문의드립니다.
0
378
1
손실함수에 대한 질문
0
359
1
card_bal 데이터셋 시각화 관련 질문입니다
0
247
1
LGBM null값 처리에 관해 질문있습니다
0
554
1
컬럼 관련 질문
0
298
1
히스토그램 x 값
0
376
1
n_iter 횟수 넘음 질문
0
509
2