
-
질문 & 답변
카테고리
-
세부 분야
데이터 분석
-
해결 여부
미해결
Female의 경우, 그래프에 제목이 나오질 않습니다.
20.12.03 23:15 작성 조회수 130
0
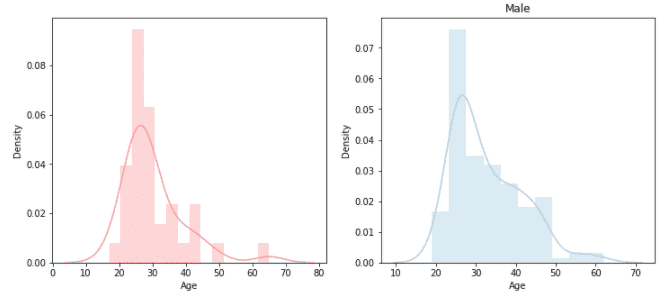
아래와 같이 코드를 실행했는데, Female 그래프에는 제목이 나오지 않습니다. 수업자료에서도 마찬가지로 Male에만 그래프 제목이 나오고 있습니다.
figure, (ax1, ax2) = plt.subplots(ncols = 2)
figure.set_size_inches(12, 5)
sns.distplot(korea["Age"].loc[korea["GenderSelect"]=="Female"].dropna(), norm_hist = False, color = sns.color_palette("Paired")[4], ax = ax1)
plt.title("Female")
sns.distplot(korea["Age"].loc[korea["GenderSelect"]=="Male"].dropna(), norm_hist = False, color = sns.color_palette("Paired")[0], ax = ax2)
plt.title("Male")

답변을 작성해보세요.

답변 0