


Learning Python Programming with Patterns Part 5 - Data Analysis
Wisdomfactory
$22.00
Basic / Python, Pandas, Matplotlib
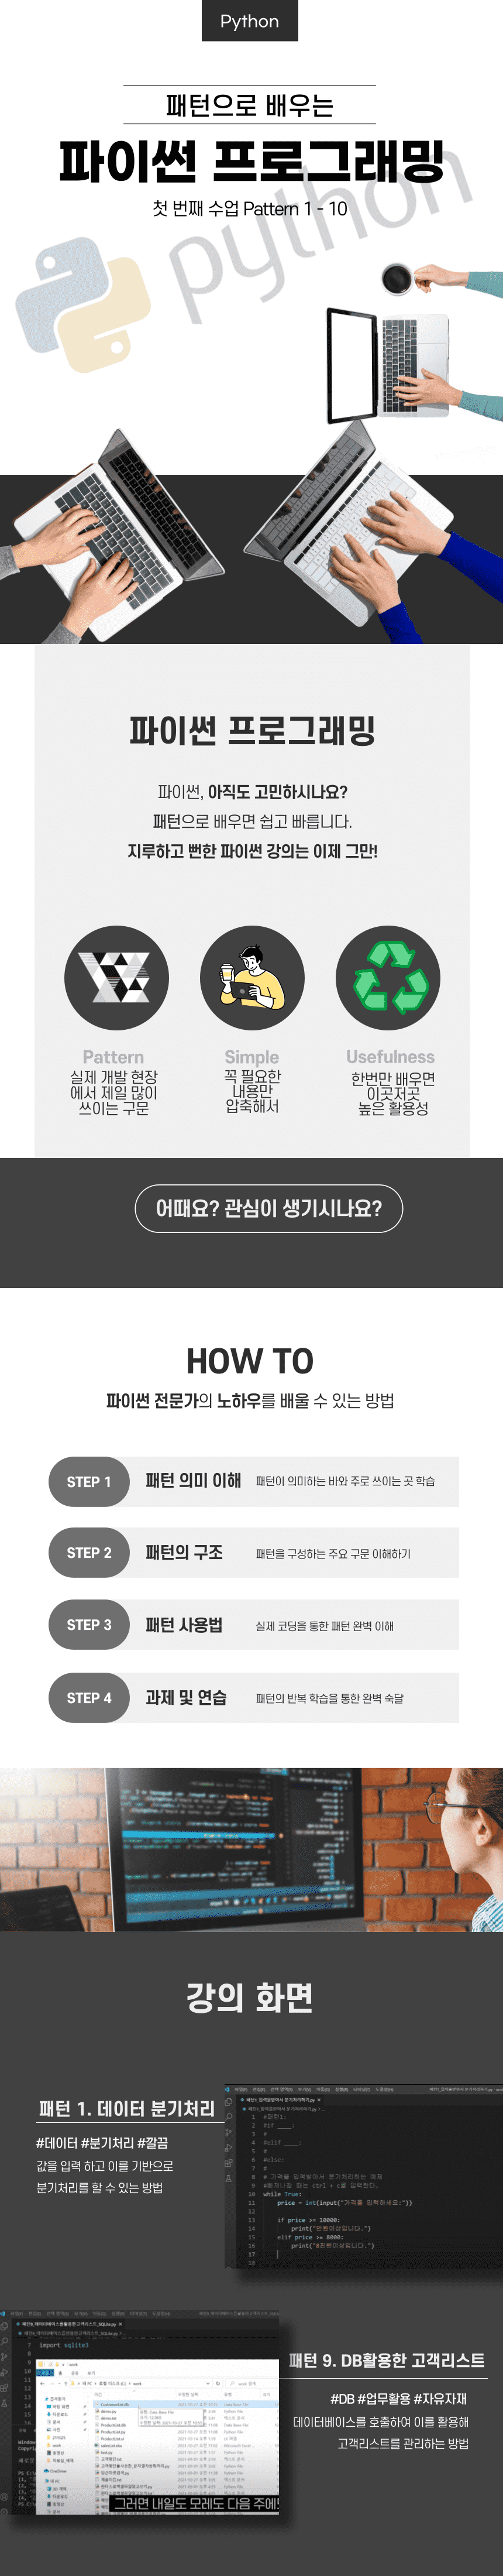
Are you familiar with Python now? Python is the most widely used language for collecting, analyzing, and utilizing data. If you want to use Python for data science, today's lesson will be really helpful. We will install and use Python modules and packages, aka libraries, related to data science.
Basic
Python, Pandas, Matplotlib


![[Renewal] Python Introduction and Web Crawling Basics Bootcamp [Python, Web, and Data Understanding Fundamentals] (Updated)Course Thumbnail](https://cdn.inflearn.com/public/courses/324082/cover/57af93de-1021-40b4-80d7-a0dfc17190cf/324082.png?w=420)


![[Python Game Development] Minesweeper Creation That Even Beginners Can FollowCourse Thumbnail](https://cdn.inflearn.com/public/files/courses/337795/cover/01k38rm474bcf23g0rwx8cs2y1?w=420)
![Coding Test Tips from a Test Creator [Coding Test with Python]Course Thumbnail](https://cdn.inflearn.com/public/courses/328755/cover/cac792f3-89c7-418b-8e23-49c5bede1bad/328755.png?w=420)

![[Renewed] MongoDB and NoSQL (Big Data) Database Bootcamp for Beginners [From Introduction to Application] (Updated)Course Thumbnail](https://cdn.inflearn.com/public/courses/324183/cover/fbe9f0cc-4c42-4435-b855-f283f6932415/324183.png?w=420)