A course that goes beyond basic visualization to allow you to utilize more advanced features of R. In addition to learning ggplot, this course also lets you experience map visualization and 3D graphs.
This course will help you utilize more features of the R language, following basic visualization, and will also cover map visualization and 3D graphs, along with learning ggplot2.
Learning Objectives
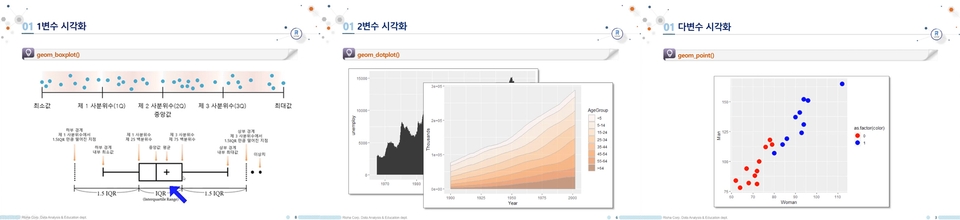
Most of the graphs used in practice can be utilized.
Helpful people
Those who need to draw graphs in earnest
For those who want more diverse graphs
Anyone who needs to visualize regional statistical data
Things to learn
Note
Prerequisite: Beginner R Visualization
Related Courses
[Give R to R] Getting Started with Data Analysis in R
R Grammar Basics This course teaches 'R Basics', one of the essential languages to choose when starting data analysis.
R Intermediate Basic course and essential R content, from package installation to loops, user functions, and removing missing and outlier values.
R Visualization Basics ggplot2, R's powerful visualization package that even Python users envy! Get started today.
Introducing the knowledge sharer
Kim Seung-wook He is an ordinary analyst who is active in various fields such as corporate lectures and private lessons. (Current) Rloha Representative Consultant (Former) NBT Data Engineer (Former) Semware Data Analysis Director (Former) Researcher at the Big Data Application Team of the Korea Meteorological Administration R Please give me some R: Learn R from the basics. Questions are always welcome. For a quick response, please use Facebook Messenger! https://www.facebook.com/encaion
Hello This is
1,249
Learners
66
Reviews
63
Answers
4.8
Rating
4
Courses
[現] Rloha 대표 [現] EpicWorks IT 팀장 [前] MMMD 데이터 분석팀 팀장 [前] 커넥텀 연구원 [前] NBT 데이터 분석팀 엔지니어 [前] 기상청 빅데이터팀 연구원


![[R을 R려줘] R 기초다지기Course Thumbnail](https://cdn.inflearn.com/public/courses/326871/cover/2ad0e730-d068-4095-ab51-62b2c94e49f8/326871-eng.png?f=avif&w=420)

 R Grammar Basics
 R Intermediate
 R Visualization Basics
![[R을 R려줘] R 데이터 시각화Course Thumbnail](https://cdn.inflearn.com/public/courses/327142/cover/f3e01d95-c3af-4003-9a16-0e328594cf8b/327142-eng.png?f=avif&w=420)
![[에피소드] 엑셀+파이썬(기초)Course Thumbnail](https://cdn.inflearn.com/public/courses/332174/cover/4bff11a1-9859-43f4-8e17-6374ee50e6d6/332174-eng.png?f=avif&w=420)
