![[Episode] Excel + Python (Basic)Course Thumbnail](https://cdn.inflearn.com/public/courses/332174/cover/4bff11a1-9859-43f4-8e17-6374ee50e6d6/332174-eng.png?w=420)
[Episode] Excel + Python (Basic)
datadoctor
Now you can use Python in Excel! A light lecture to try out the latest features!
Basic
Excel, Python
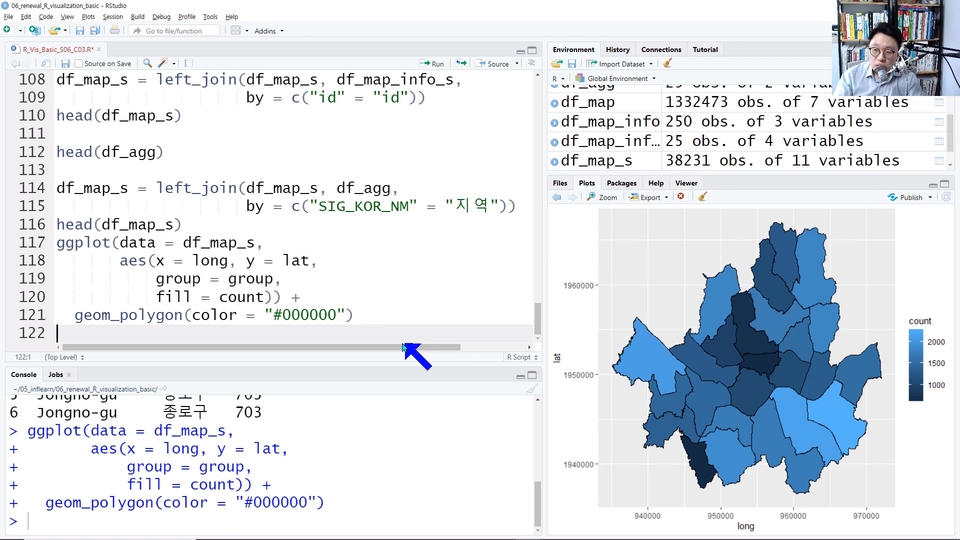
The easiest explanation of R-based data visualization📊. (Almost) everything you need to know😎. At the end, we will plot COVID-19 💉vaccine vaccination data on a map🗺️!

Reviews from Early Learners
5.0
magnet0922
This has really helped me learn visualization using R!
5.0
e89cokr
This is exactly what I'm looking for ^^ I'm studying well because the lectures explain things so well. If I follow along and review, I think I'll be able to acquire enough knowledge about R.
5.0
진승준
Thank you for the great lecture.
Graphs using basic functions
ggplot2 Basics
Basic Graphs (Scatter/Line/Bar)
Learn R data visualization properly!
Come join us at [R for R] ✨

When analyzing data, how can we see the characteristics of the data we need to deal with at a glance? How can we find insights from the data more easily and better? Listed numbers or tables have their limitations. That is why data visualization is important.
![]()
The most popular R data visualization library,
Let's draw a graph with ggplot2 .
Scatter plots, line graphs, bar graphs, etc.
Learn how to present data effectively.
If you have some basic knowledge of R and can freely visualize data using basic R functions and the ggplot2 package, you will be very efficient .

OK to see the big picture
Data to be analyzed
Trend
It's easy to understand.

Compare at once
Several figures
Compare at once
It's easy.

Shorten your working hours!
To analyze data
The time needed
It decreases.

I majored in business analytics for my master's degree at UNIST and started data analytics. I started working in the data analytics team from my first career, and I am currently constantly working on outsourcing related to data analytics as well as corporate/school lectures. 😎
Q. I don't know anything about R. Is that okay?
It's not okay at all. If you haven't taken [R for R] Basics, you should be able to install and load packages/input/output files/filter data frames to be able to take the course without difficulty.
Q. What is ggplot2? Why learn it?
There are many functions in R that can draw graphs, but they are too crude and difficult to handle, so I don't use them often. I will focus on learning the ggplot2 package, which helps me draw more attractive and pretty graphs more conveniently.
Q. Even if I learn this, won't I still be able to draw graphs with the data I have?
You will be able to draw graphs that can be inserted into papers on your own.
Q. How well will I do if I study and understand everything that comes out here?
It will be very helpful because it goes beyond just introducing various functions and provides hands-on practice using various data.
Please check!
Who is this course right for?
Those who have a basic knowledge of R
If you want to explore data more effectively
Anyone who needs R-based visualization
Need to know before starting?
R Basics
1,288
Learners
70
Reviews
63
Answers
4.8
Rating
4
Courses
[Current] CEO of Rloha
[Current] IT Team Lead at EpicWorks
[Former] Data Analysis Team Lead at MMMD
[Former] Researcher at Connectum
[Former] Data Analysis Team Engineer at NBT
[Former] Researcher at the Korea Meteorological Administration Big Data Team
I primarily lecture on data analysis for Samsung Group affiliates. Accumulated corporate and university lecture time exceeds 8,000 hours. (As of 2025.12) contact@rloha.io
I primarily conduct data analysis lectures for Samsung Group affiliates.
Over 8,000 cumulative hours of corporate and university lectures. (As of Dec 2025)
Analysis Team Engineer [Former] Researcher at the Korea Meteorological Administration Big Data Team. Primarily lectures on data analysis for Samsung Group affiliates. Over 8,000 cumulative hours of corporate and university lecturing. (As of Dec 2025)
contact@rloha.io
All
24 lectures ∙ (8hr 33min)
Course Materials:
All
10 reviews
5.0
10 reviews
Reviews 1
∙
Average Rating 5.0
Reviews 7
∙
Average Rating 5.0
Reviews 6
∙
Average Rating 5.0
Reviews 14
∙
Average Rating 5.0
Reviews 1
∙
Average Rating 5.0
Check out other courses by the instructor!
Explore other courses in the same field!
![[R for R] Building the basics of RCourse Thumbnail](https://cdn.inflearn.com/public/courses/326871/cover/2ad0e730-d068-4095-ab51-62b2c94e49f8/326871-eng.png?w=420)