

Data visualization using Gephi
This course will teach you how to visualize and analyze data using Gephi. It will start from the basics of graph theory and proceed to visualization practice using Gephi.
What you will gain after the course
You can quickly visualize your dataset as a network graph and easily analyze it using basic graph theory.
Network models can provide insights needed for decision-making, such as understanding relationships between content to plan effective bundled products or identifying important communities to conduct targeted marketing.
From the basics of graph theory
Complete Gephi practice in one lecture! ⭐
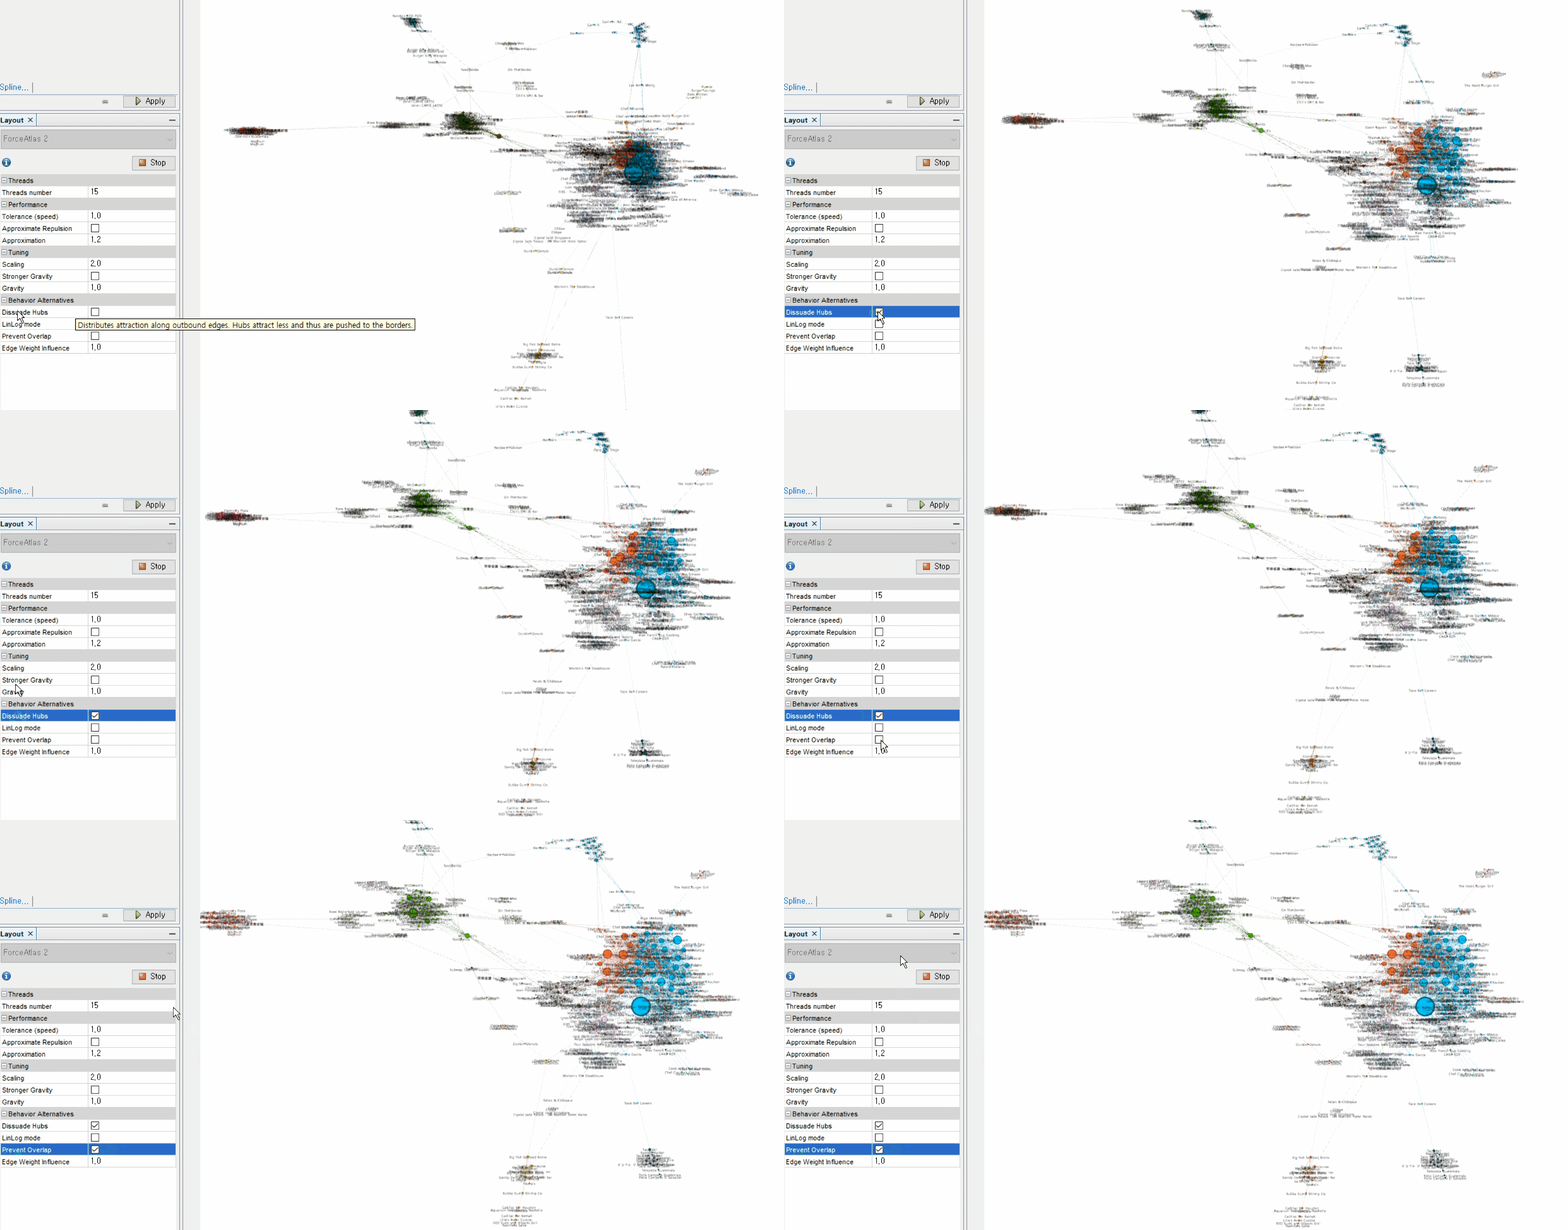
Data Visualization with Gephi 💡
We live in the age of data. Data is everywhere, so much so that the term "big data" has emerged. Where does all this data come from? It's generated from relationships. Followers on social media, accessing websites online, trading goods, communicating via messengers, participating in collaborations, and so on. The sources are endless.
We derive data from relationships. And conversely, we can infer real-world relationships from that data. For example, we can identify relationships between content to plan effective bundled products, or identify high-value communities to conduct targeted marketing.

I believe that the next 100 years will be an era of complexity.
- Stephen Hawking, January 2000
As the world becomes more complex, these relationships have become entangled, forming networks: communication networks, neural networks, social networks, power grids, transaction networks, and so on. Data analysis emerged to predict the future and develop strategies in this complex world. Network analysis is a unique and fascinating field among the many fields of data analysis. If you're interested in unraveling the relationships between different Stuffs, you'll find network analysis quite fascinating.
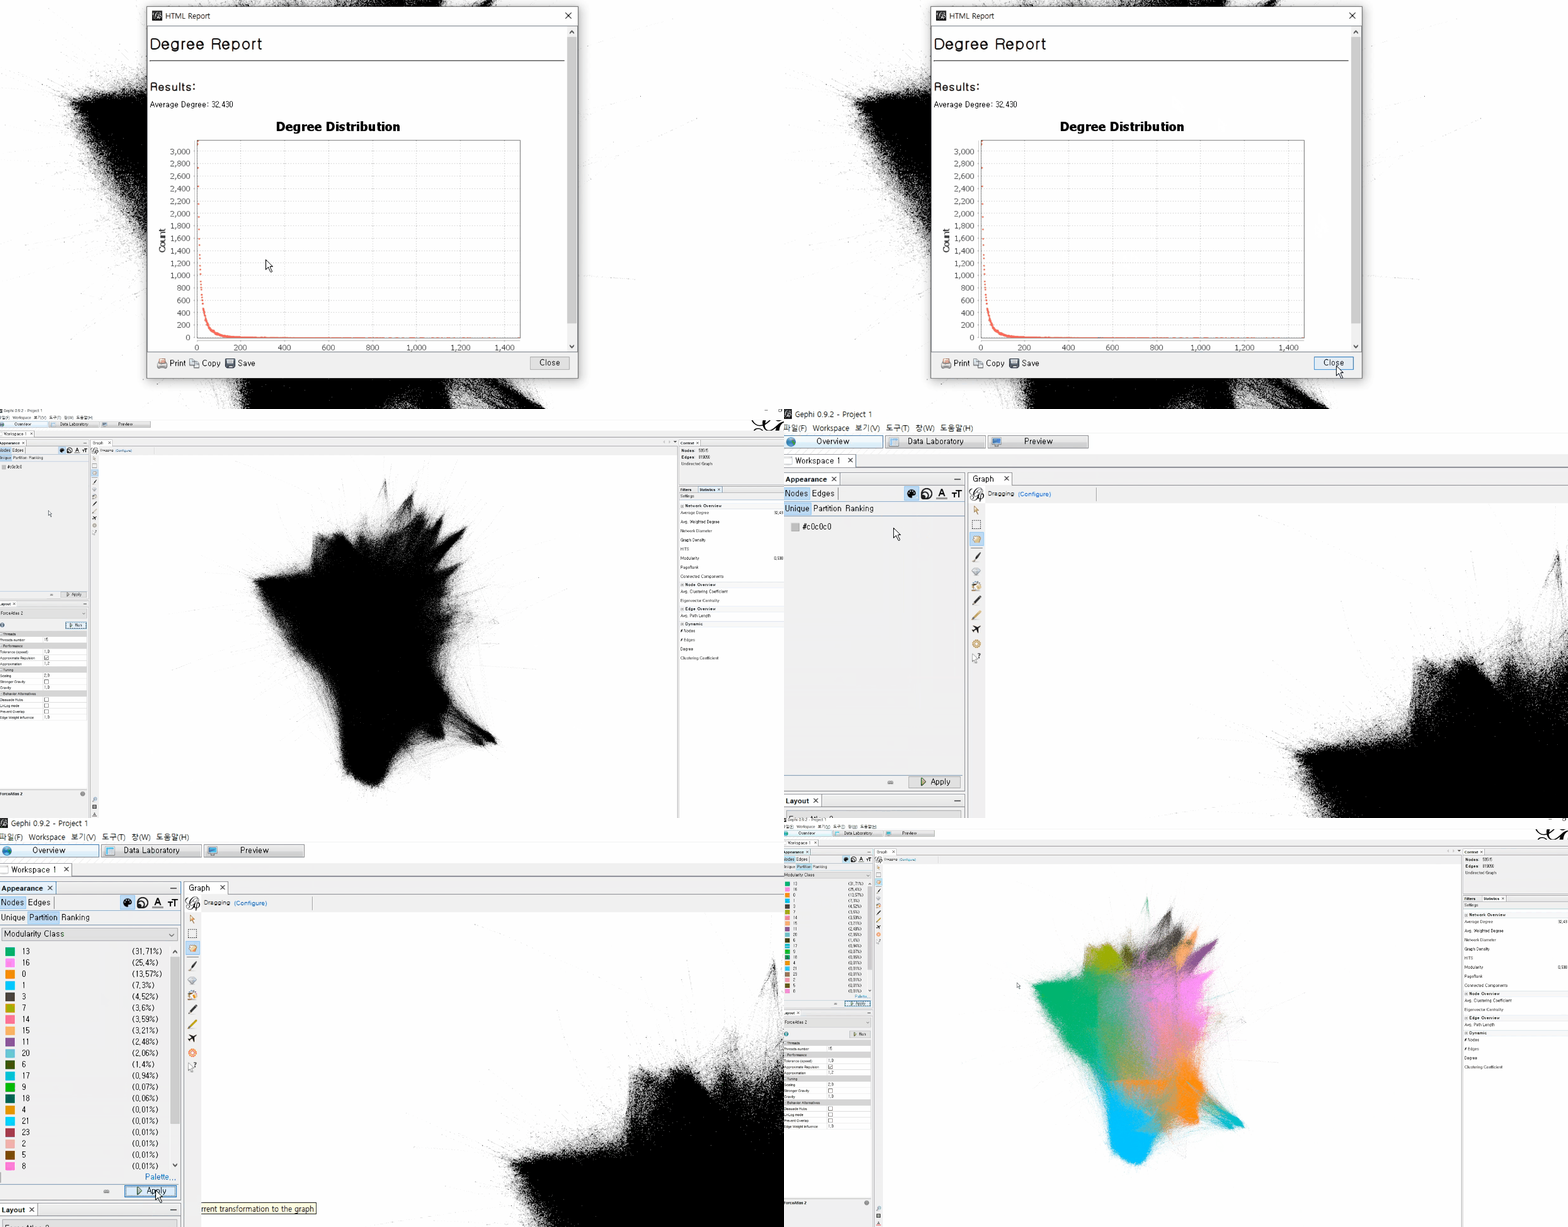
In this course, we'll use Gephi, a powerful visualization tool . Given a dataset, this tool is powerful enough to produce compelling results from scratch. However, to fully utilize its features and understand the context of the results, a basic understanding of the theoretical foundation is required.
Data analysis, when delving into the theoretical aspects, is a field that encompasses linear algebra and probability/statistics. However, this course will focus on visualization and analysis, and the theoretical aspects will be explained with minimal formulas for intuitive understanding.
Learn things like this 📚

Quickly visualize your dataset as a network graph

Simplify data analysis with basic graph theory

Gaining the insights you need for decision-making through network models.
I recommend this to these people 🙋

Anyone who wants to quickly start analyzing network data

For those who want to learn graph theory through visual learning

Anyone who wants to gain insights through analytics data

Anyone who wants to analyze behavioral relationship data to help with decision making
📢 Please check before taking the class!
- You will need a PC or Mac with Linux installed.
- If your computer's specifications are too low, computation speed may be somewhat slow. However, this should not significantly affect your ability to attend lectures.
- Gephi is version 0.9.2, and the installation method will be explained in the lecture.
- This lecture does not cover how to prepare a dataset. The dataset required for the exercises is provided in the course. If you wish to use your own data, you will need to obtain it through crawling or importing it from an analytics tool.
Recommended for
these people
Who is this course right for?
For those who want to quickly start analyzing network data
For those who want to learn graph theory through visual introduction
Anyone who wants to gain insights through analytics data
Anyone who wants to analyze behavioral relationship data to help with decision making
Need to know before starting?
As background knowledge, you should have heard of exponential, logarithmic, and normal distributions.
Hello
This is ssenta

59
Learners
3
Reviews
5.0
Rating
1
Course
I work as a PM building IT services. I want to help those who need my experience and knowledge, and I hope to create a space where we can share them together.
Curriculum
All
30 lectures ∙ (4hr 41min)
Course Materials:
2. graph
05:23
5. Edge
07:34
6. Degree
05:55
11. Modularity
08:15
12. Centrality
13:08
13. Installing Gehpi
04:33
Reviews
All
3 reviews
5.0
3 reviews
 seliscos4970
Reviews 2
∙
Average Rating 5.0
5
83% enrolledIt was hard to find a lecture on network graphs, but I found it and am listening to it diligently. Thank you. Please give me many good lectures.
- ssentaInstructor
Thank you, Jeong Ho-jung!!
- luckiness14341
Reviews 1
∙
Average Rating 5.0
5
100% enrolledThis is the visualization tool I wanted to learn, and you explained it well. I'm looking forward to the next lecture.
- ssentaInstructor
Thank you Luckyness :)
- n03192296980gbp1050
Reviews 2
∙
Average Rating 5.0