Hello. Thank you to everyone who took the course.
💻 Finding Signal and Noise by Collecting and Analyzing Securities Data 👉 http://bit.ly/inflearn-finace-data
We have opened a new course. We are offering a 30% discount during the early bird period.
📈 Finding Signal and Noise in Securities Data
We currently receive and analyze stock price data that is rising and falling in real time.
Learn how to collect data yourself without using data collected by someone else.
Learn how to preprocess.
The purpose is to learn and apply data analysis methods for use in work or research.
📊 Why it's good to learn data analysis with securities data
Did you know that Pandas was developed by quants working in the financial world?!
Securities data is data that can be applied with various analysis methods, formulas, statistics, etc.
What if you need to copy and paste content from dozens or hundreds of pages of websites into Excel?!
What if your collected data is so messy that you don’t know where to start?!
What is the difference between categorical data and numerical data?
What is the right visualization method to find signal and noise in data?!
You will learn how to handle data in various formats.
I also tried implementing technical analysis such as moving averages, Bollinger Bands, MACD, and RSI.
You can even draw it with a line or two of code using an already implemented library.
Understand the principles of technical analysis
Let's implement a chart like you see in HTS or MTS.
⚡️ Course Features
🧹 Data from web pages that seemed like they could only be collected using heavy tools like Selenium
Learn how to collect this in a line or two of code using the network tab in your browser.
You can directly collect and analyze the information you need for work or research.
📈 Learn how to use dynamic visualization tools as well as static ones.
🛠 It's difficult to learn many tools at once.
Even if you use various tools, if you understand only the core functions,
Knowing how to view and understand documentation even when tools change
You won't be afraid when new libraries appear.
💡Someone has created an abstract library for any feature we feel we need.
Learn how to install and get familiar with new tools.
🛠 Introduction to learning skills
🐼 Pandas : A representative data analysis tool in Python, created for financial data analysis.
🧮 Numpy : Python's numerical calculation tool.
📊 matplotlib : Python's representative data visualization tool.
📊 seaborn : A high-level visualization tool that abstracts matplotlib for easy use and provides basic statistical operations.
📊 plotly : Provides high-level and low-level visualization features and allows interactive visualization.
📊 cufflinks : A productive tool that powerfully connects plotly and pandas.
📈 FinanceDataReader : A tool that allows you to collect financial data with just one or two lines of code.
🌏 Requests : This is a tool that can receive the source code of a web page via HTTP communication.
🔍 BeautifulSoup4 : A tool that can retrieve desired information from the source code of a web page.
⏰ tqdm : You can view the progress of long-running tasks such as data collection or preprocessing.
📊 How to use and the differences between various visualization libraries

Image source: https://pyviz.org/overviews/index.html
💻 Provides two types of practice materials: a file without code (input) and a file with code (output).
You can follow the lesson line by line by directly entering the code into the blank cells with the description.
You can also practice by running the file containing the code .
You can review by listening to the lecture and filling in the blank cells .
📈 Implement auxiliary indicators (moving average, Bollinger bands, RSI, MACD) that can be seen in HTS and MTS and understand the principles

🙋♀️ Expected Questions Q&A
• Can non-majors also take the course?
Regardless of your major or non-major, data analysis can be used in many ways if you learn it. If you learn data analysis techniques using Python instead of Excel, you can use them in various ways for work and research. I have already conducted corporate lectures for non-development positions through offline curriculums on this content. I conducted various interviews about the areas where people find it difficult and supplemented the curriculum. Learning the core functions for analysis and visualization will help you increase work efficiency.
• Why should I learn data analysis and collection techniques with Python?
Excel is one of the essential skills for office workers, regardless of the job. However, Excel has limitations in terms of the size and type of data that can be imported, but if you learn it through Python, you will be able to handle various formats and large amounts of data.
• What are the benefits of learning data analysis and collection techniques?
There are often repetitive tasks that require you to go through each page, drag and drop, and copy and paste to collect the data you need. Now, you can leave this to Python ⏰ and invest your time in more productive work or just take a break 🧘♀️.
• What can I do after taking the course?
You will be able to directly collect, analyze, and visualize data generated from work and research, and apply it to production volume, inventory volume, sales volume, traffic volume, etc. It can also be used to analyze the industry, theme, or ETF of the stock you are investing in, but investment opinions will not be provided in the lecture.
• Is there anything I need to prepare before attending the lecture?
It would be helpful to understand the concepts of variables, numbers, characters, lists, etc. in Python. Also, a middle school level knowledge of mathematics such as mean, median, variance, standard deviation, and percentile is required.
• To what extent does the course content cover?
Collect, preprocess, analyze, and visualize securities data. Covers basic to intermediate Python skills. The difficulty level increases significantly from collecting industry theme information. The goal is to be able to directly utilize data analysis in various fields such as planning, marketing, sales, and operations. If you are new to programming, you may feel difficult from the middle of the lecture. In this case, I recommend that you look at the completed file with the name output at the end of the file name among the materials provided by the instructor and create a code cell right below it and follow along.• What level of computer performance is required to take the course?
Any PC or laptop with more than 4G of memory and about 20G of remaining storage space will do. If your computer's performance is low, you can try practicing through Google Colaboratory .• Can I organize the class content and publish it on my personal blog or GitHub?
The copyright notice is on the GitHub page of this lecture. Please indicate the source when organizing and publishing it.⚠️ Please check before taking the class.
Those who expect that learning data analysis will help them make big profits in the stock market
This lecture is not a securities investment lecture, but a data analysis lecture . Unfortunately, if you expect investment-related skills, you may be disappointed. Also, even if you invest using the analysis techniques learned in the lecture , the investor is responsible for any investment losses.Please listen to some of the lectures that are available through Infraon Preview or the knowledge sharer's YouTube channel before deciding whether to take the course .
You can preview some lectures before taking the course. Check if it is the direction you want to study. Also, if you have any questions, please ask them through the inquiry before taking the course.📈 Finding Signal and Noise by Collecting and Analyzing Securities Data 👉 http://bit.ly/inflearn-finace-data
There will be a 30% discount during the early bird period!
thank you
hello.
It's been over a year since I started running the course " Data Analysis and Visualization in Just Two Documents ".
Like the course “Getting Started with Python Data Analysis with Public Data,” this course will also be updated regularly.
The course " Data Analysis and Visualization in Just Two Documents " has added content on the analysis of the current status of COVID-19 in Seoul.
And to celebrate the update, we're offering a 20% discount until July 24th .
Even if you don't take the course, you can view some of the lectures in " Data Analysis and Visualization in Just Two Documents " and download the entire source code from the course .
We crawl, preprocess, analyze, and visualize the confirmed case status data released by Seoul Metropolitan Government as of June ( https://www.seoul.go.kr/coronaV/coronaStatus.do ) using Pandas.
Analyze what you have learned in just two documents into a project similar to your current job
We will analyze the Seoul City COVID-19 outbreak status site using Pandas, from crawling to preprocessing, analysis, and visualization.
We directly analyze data that we frequently encounter through news articles and daily life.
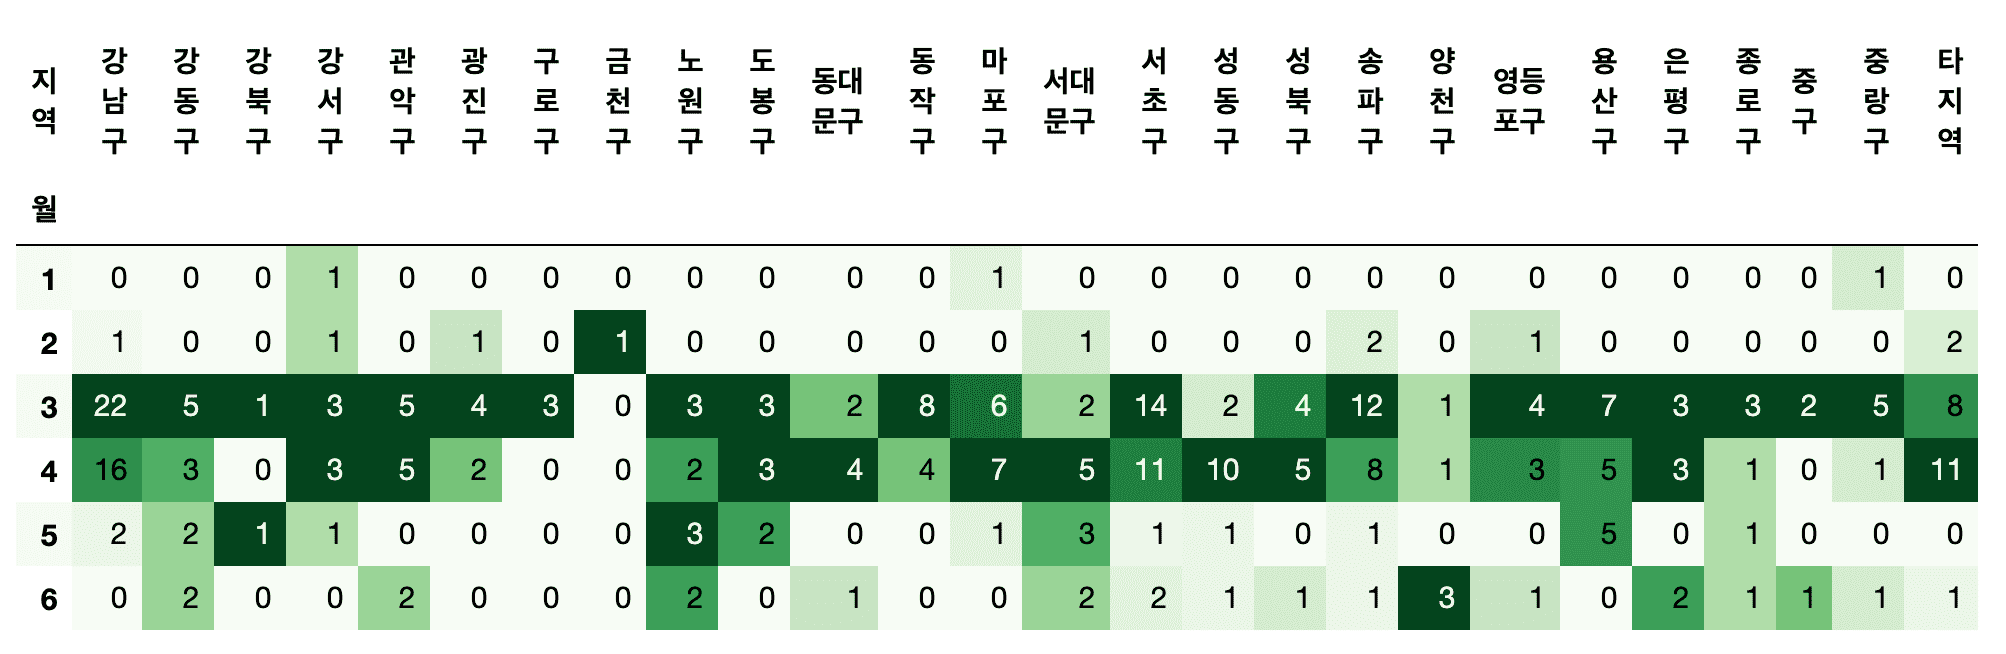
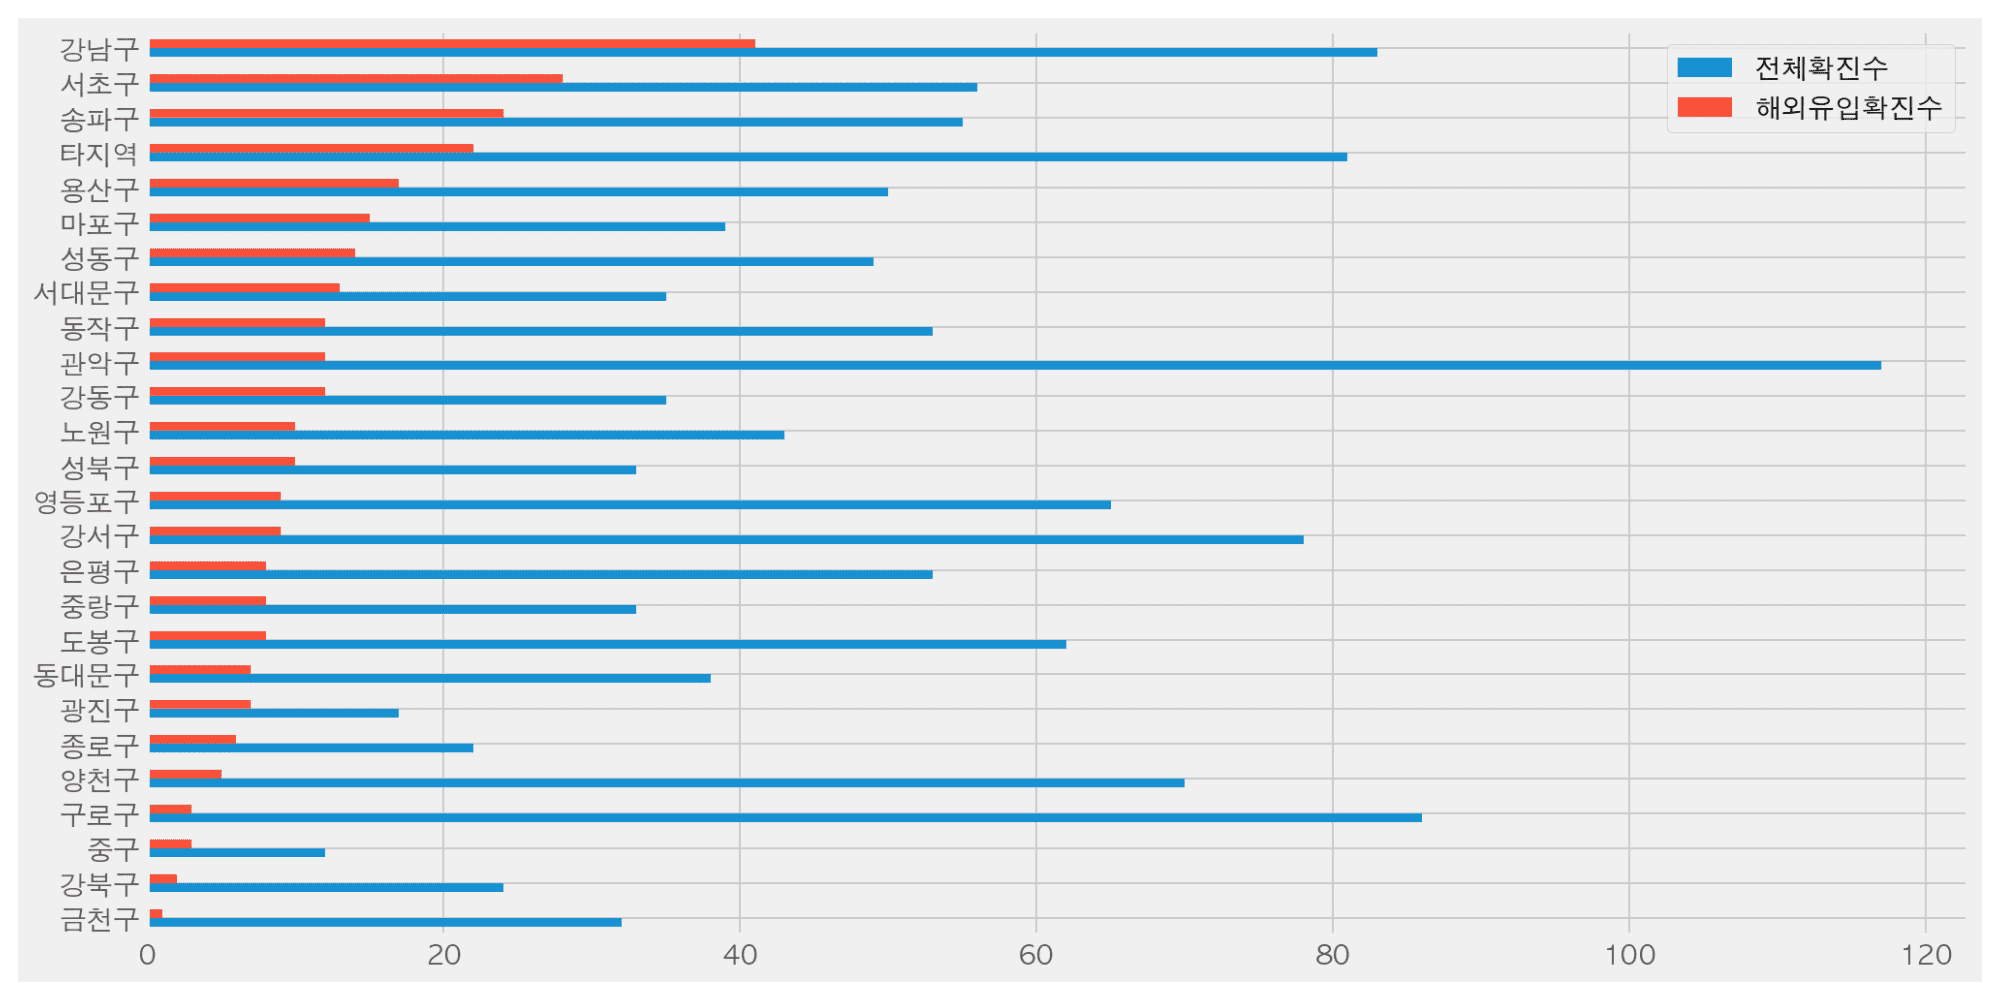
- Which district has the most confirmed cases?
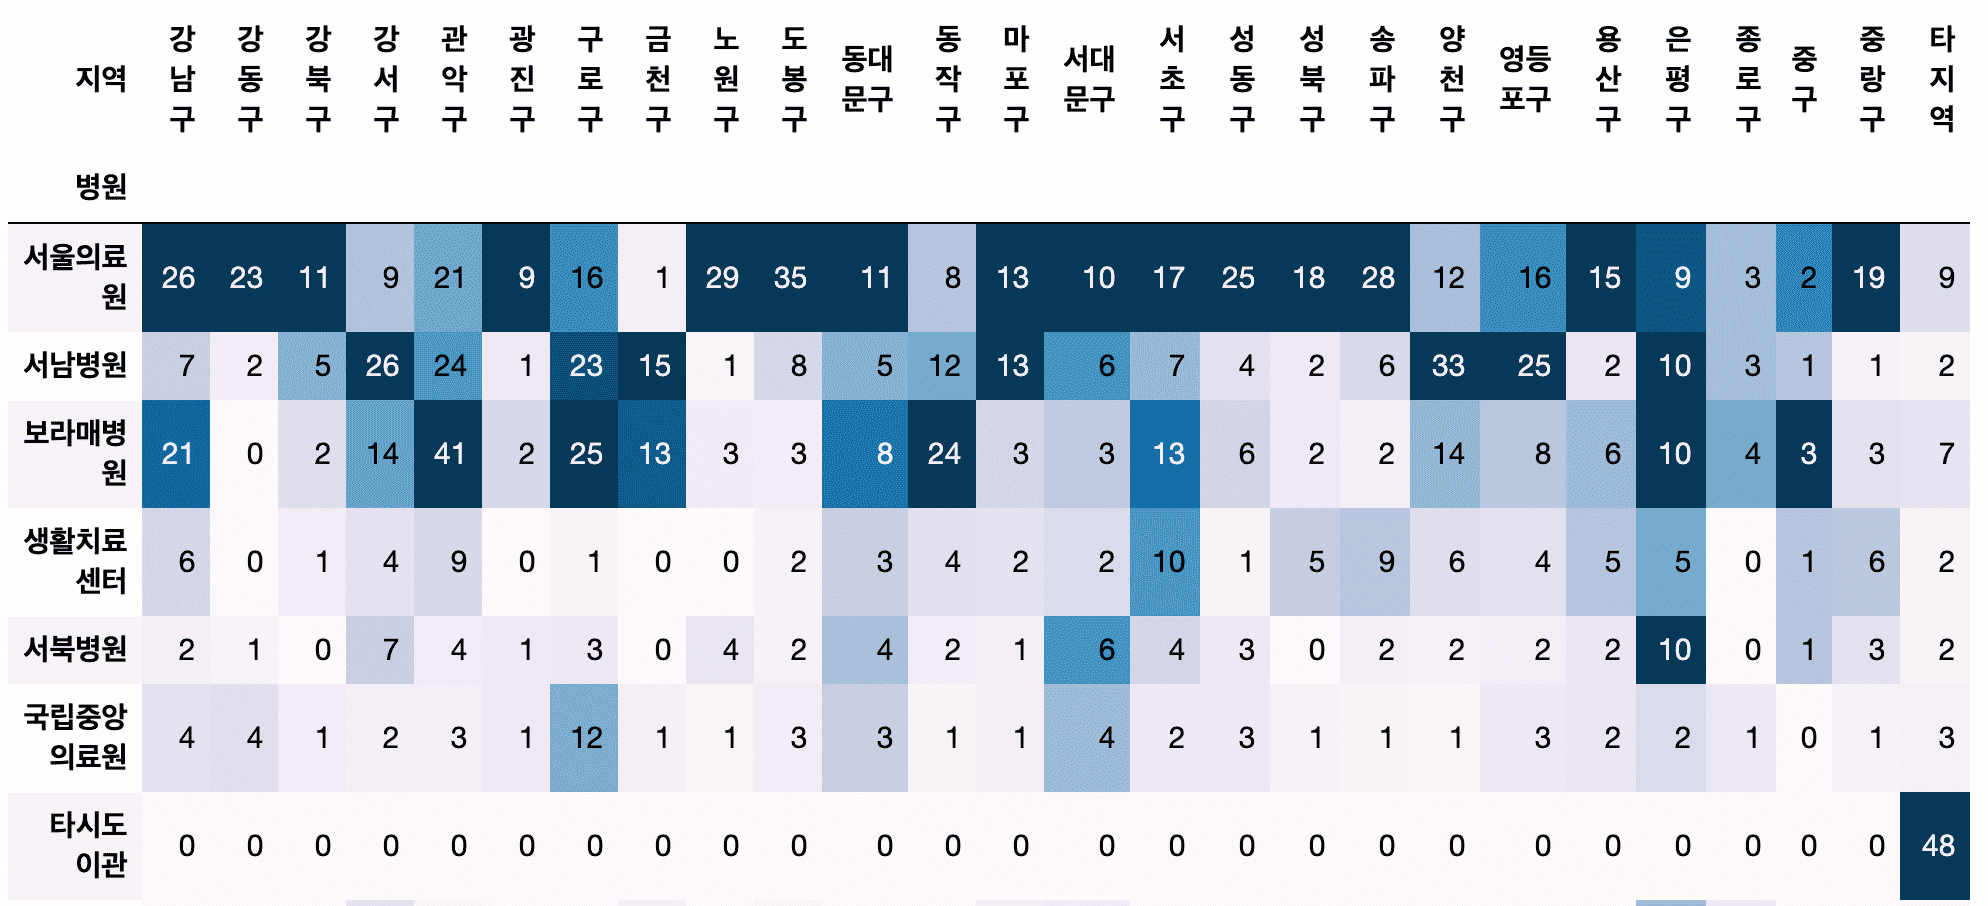
- Which hospital treated the most confirmed cases?
- Are there any hospitals that people are frequently transferred to by district?
- Which district has the most confirmed cases from overseas?
- How can I preprocess texts from multiple countries, such as Europe, South America, etc?
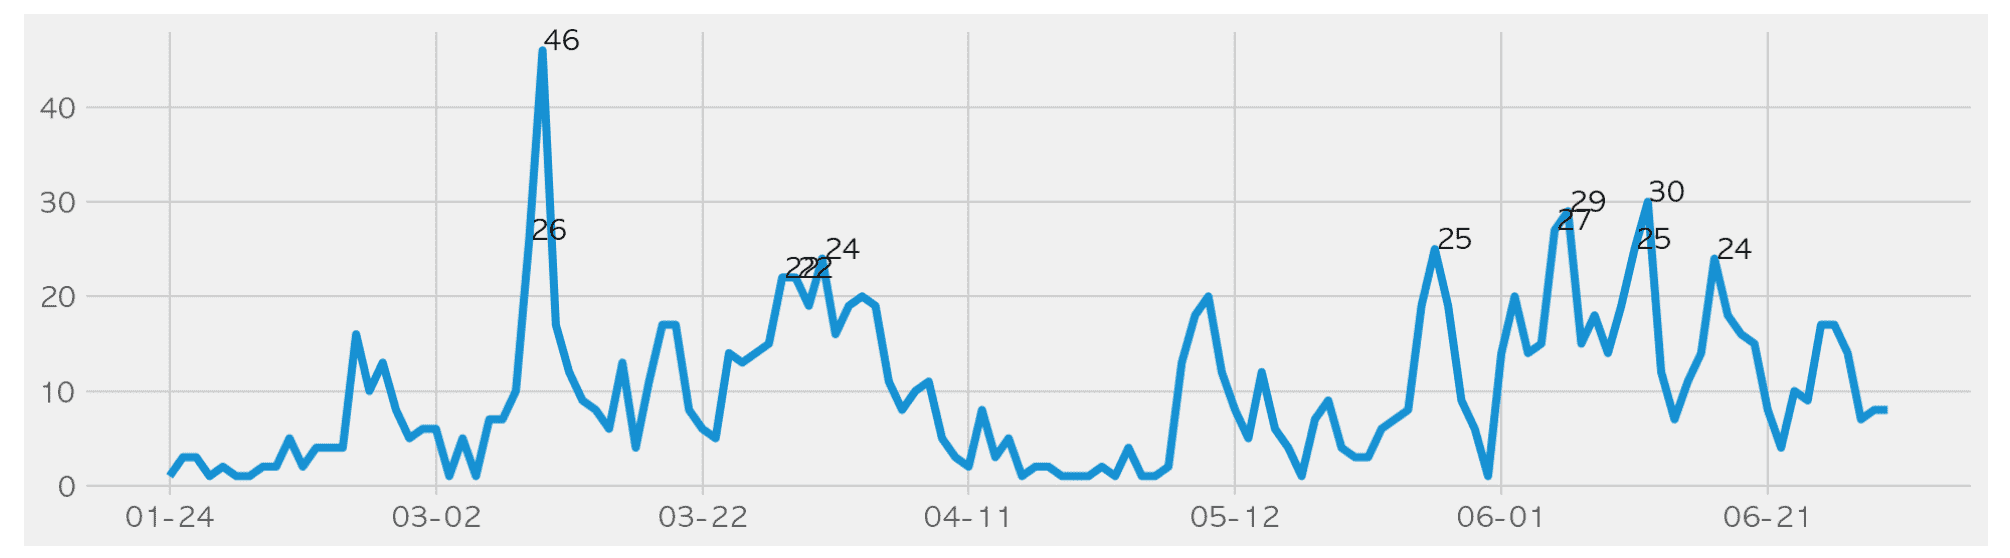
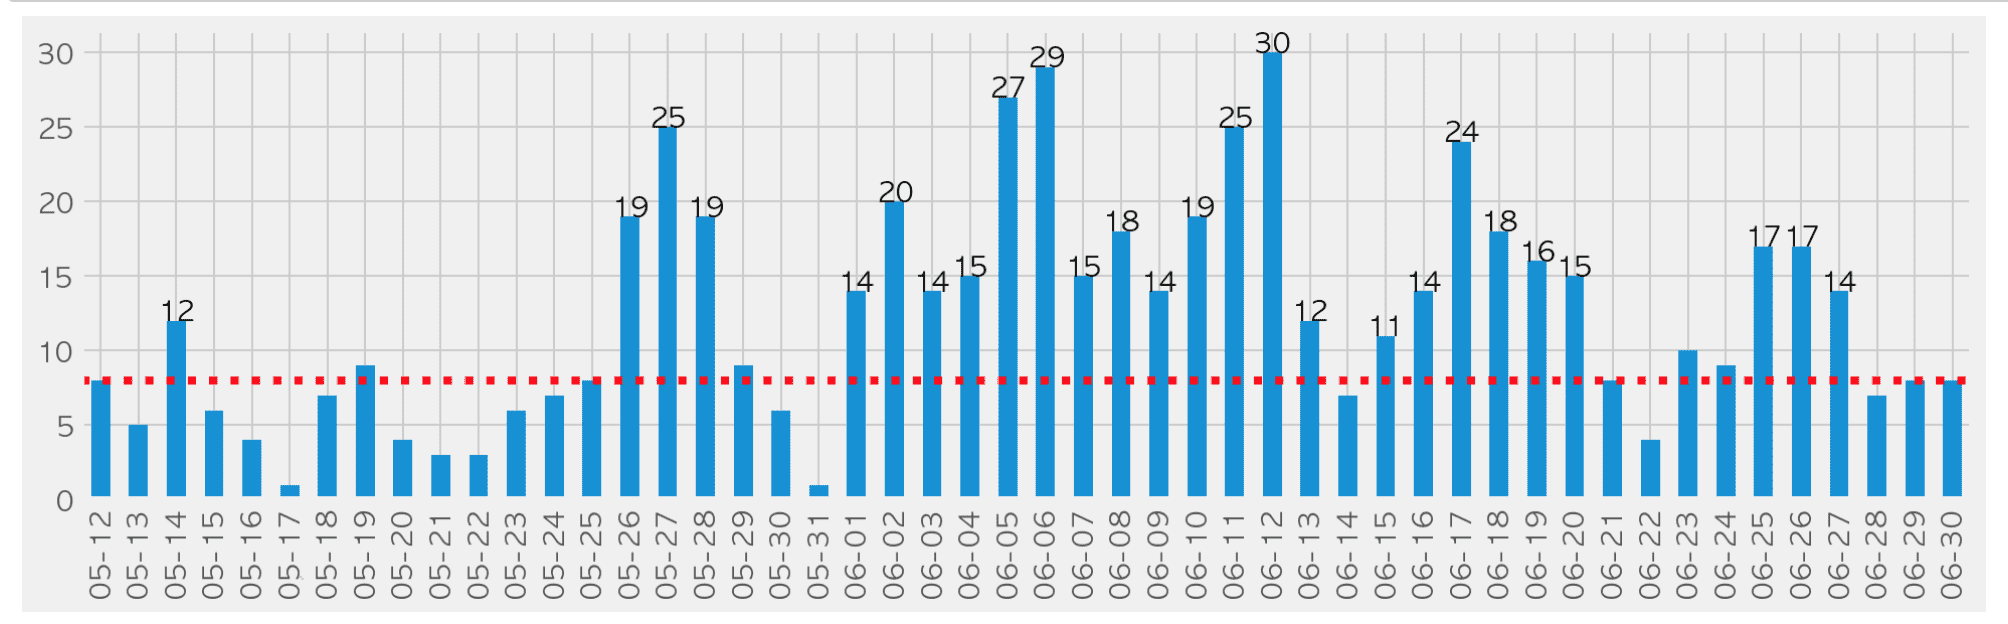
- How much does the number of confirmed cases coming from overseas vary from month to month?
Understand and practice data preprocessing methods using Pandas.
- How do I get the year, month, day, day of the week, and week number from a text date?
- How can we calculate the cumulative number of confirmed cases using confirmed case status data?
- What is the difference between groupby, crosstab, pivot, and pivot_table, and which function is more appropriate to use?
Understand the data structure of data frames and series and process them into a form suitable for analysis.
- How should I create a data frame for drawing a graph using Pandas' plot?
- How can I change my dataframe if I want to display values in different colors based on their categorical values in the graph?
- Is there any way to convert a series to a dataframe?
Check it out for yourself in class!
Thanks to all the questions and great reviews you've left over the past year, I've been able to update the course.
We will continue to improve and update the course in the future.
If you leave a good review, it will be a great help in continuously improving the content.
I hope we can get rid of COVID-19 and get back to our normal lives!
thank you
hello.
📊 The course “Getting Started with Python Data Analysis Using Public Data” has been completely renewed .
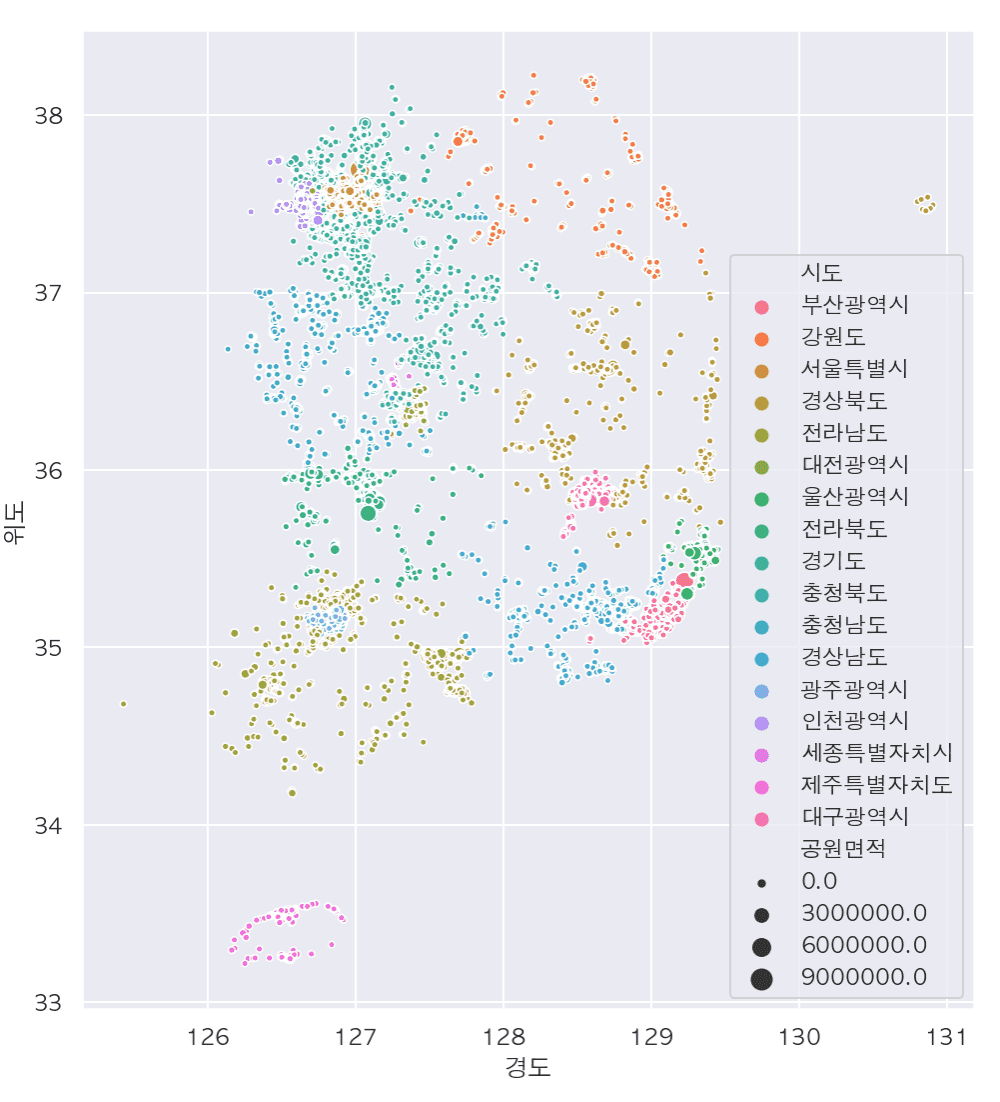
Following Chapters 1 to 4, [Chapter 5: Analysis of Standard Data in Urban Parks] has reorganized the course to focus on data preprocessing.
✍🏻Both the code and the video have been rewritten .
📈[Chapter 5] Content on data preprocessing has been significantly increased from 55 minutes to 217 minutes .
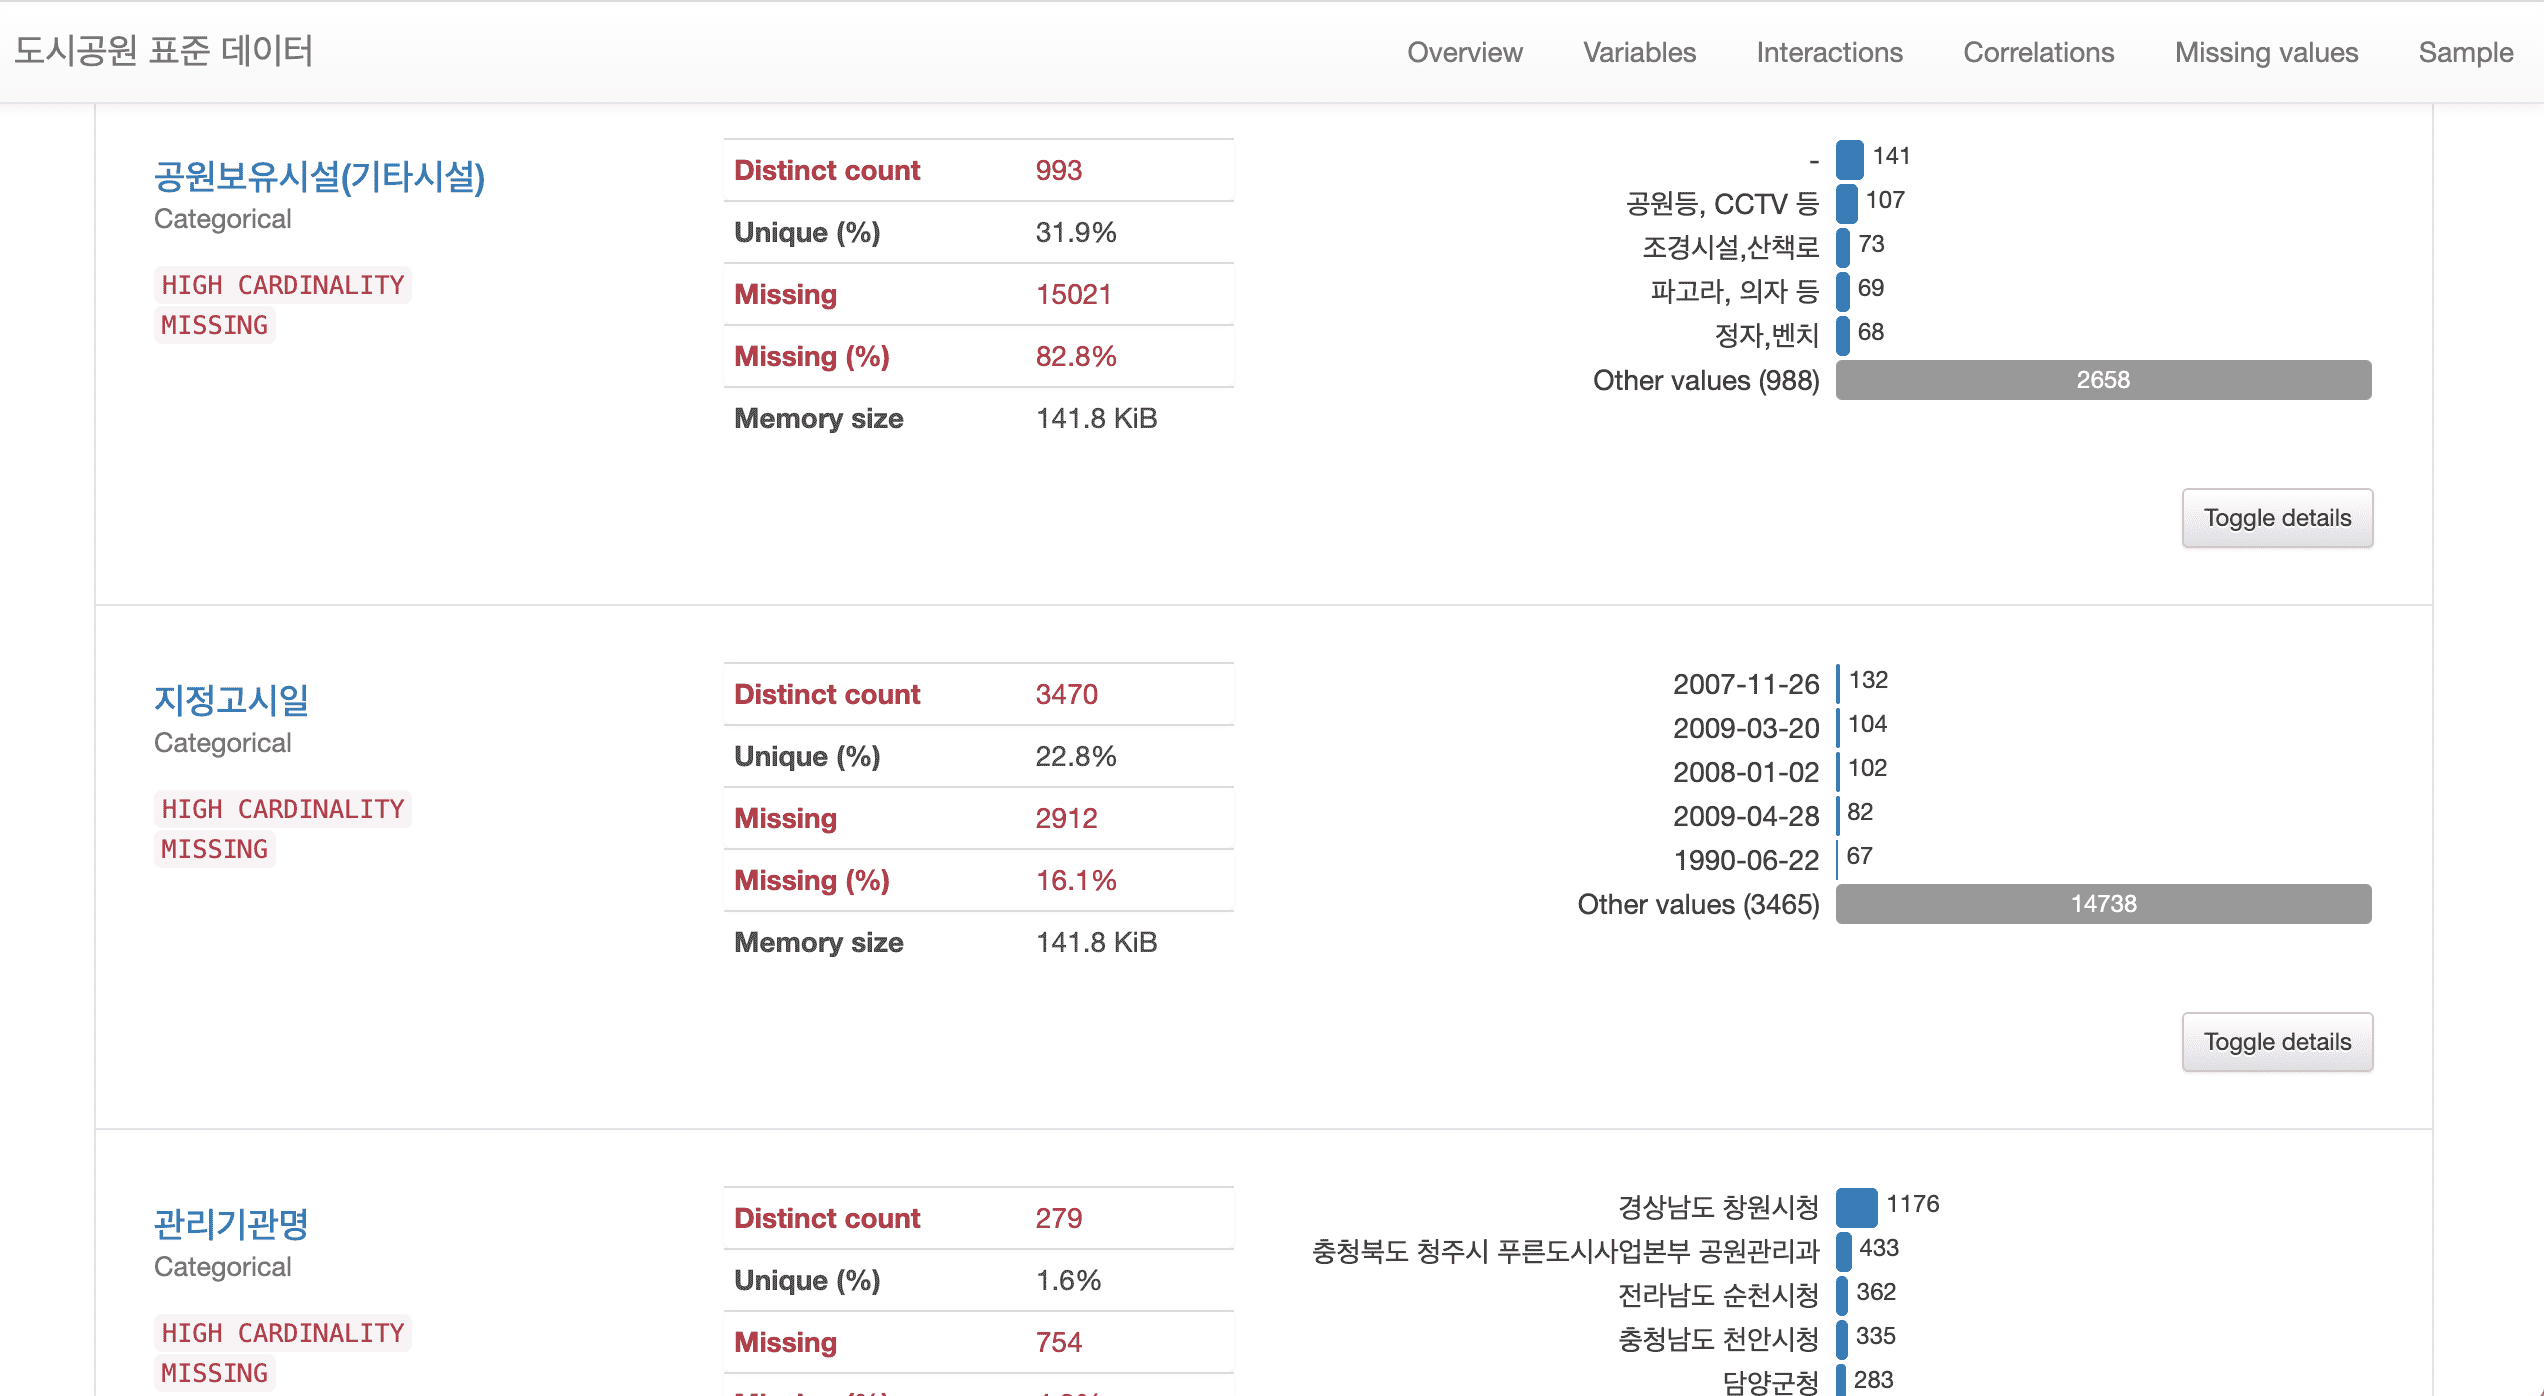
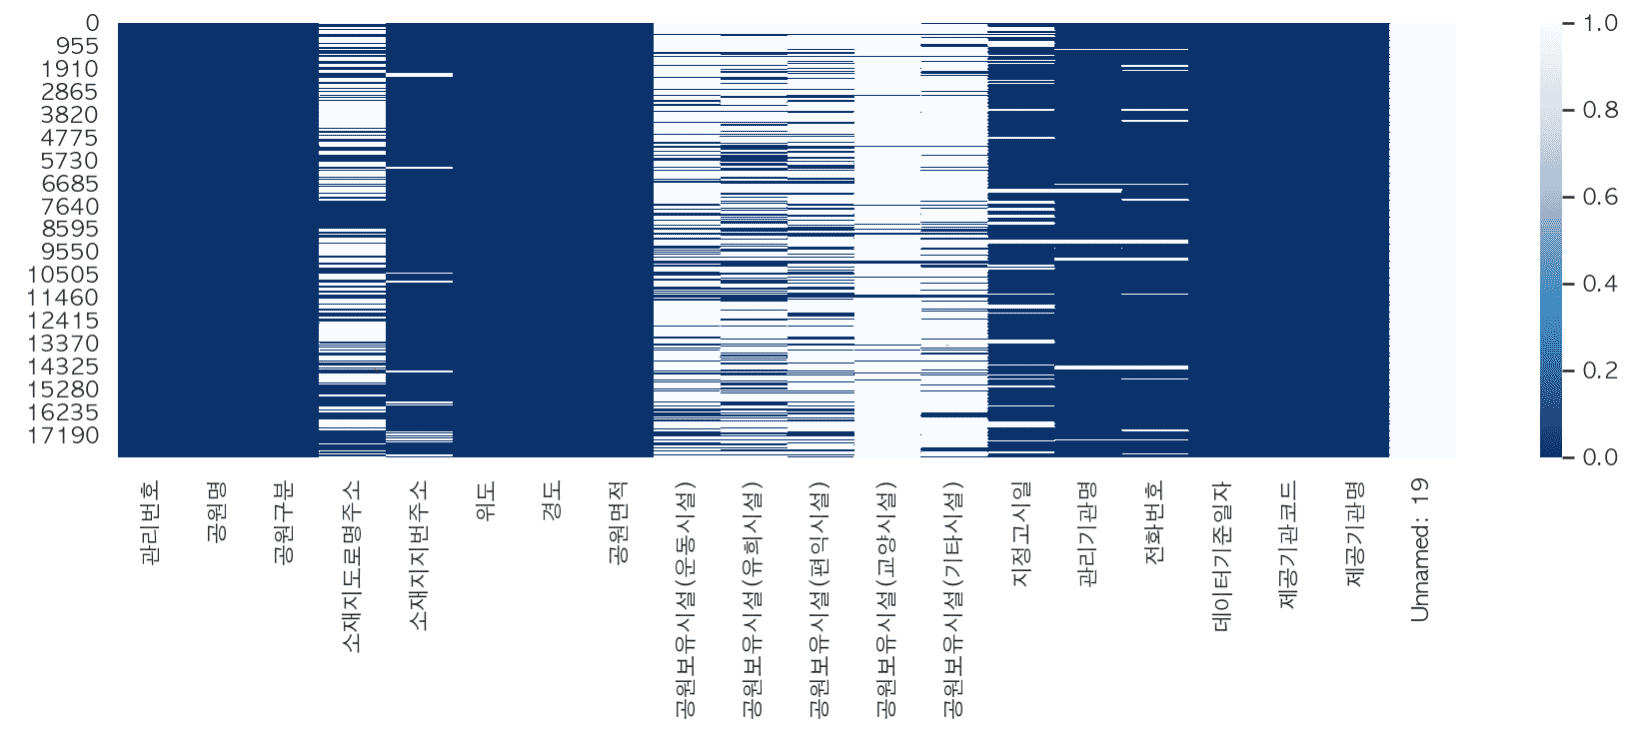
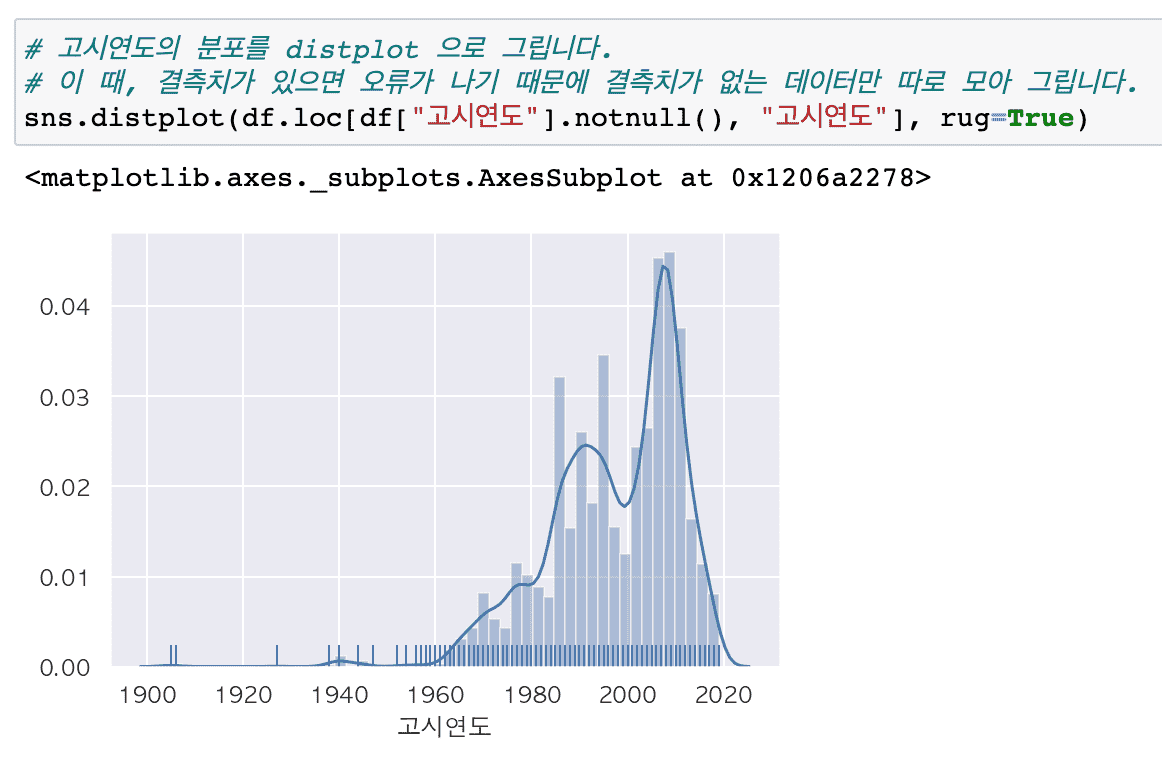
# The city park standard data requires various data preprocessing such as missing values, outliers, error values, and dates, so I think it would be suitable for those who want to learn preprocessing through real data.
# Added a method to generate reports using Pandas Profiling, which allows for easy and powerful technical statistical analysis using various libraries.
# A method for preprocessing text data using regular expressions has been added. In addition, text data can be visualized in various ways.

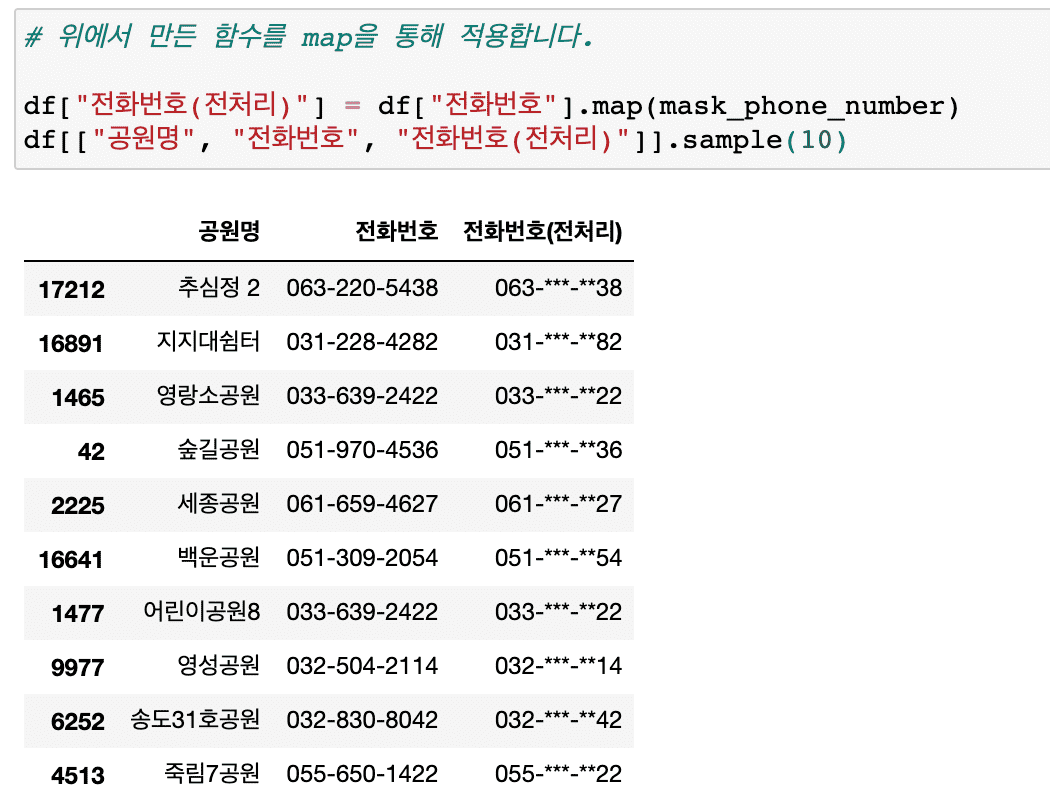
# Information masking techniques essential for personal information protection, etc. have been added.
In this lecture on analyzing the distribution of existing urban parks, we have significantly supplemented the content on various techniques that can be frequently encountered in preprocessing work.
In particular, new content has been added so that you can learn about text preprocessing and analysis using regular expressions .
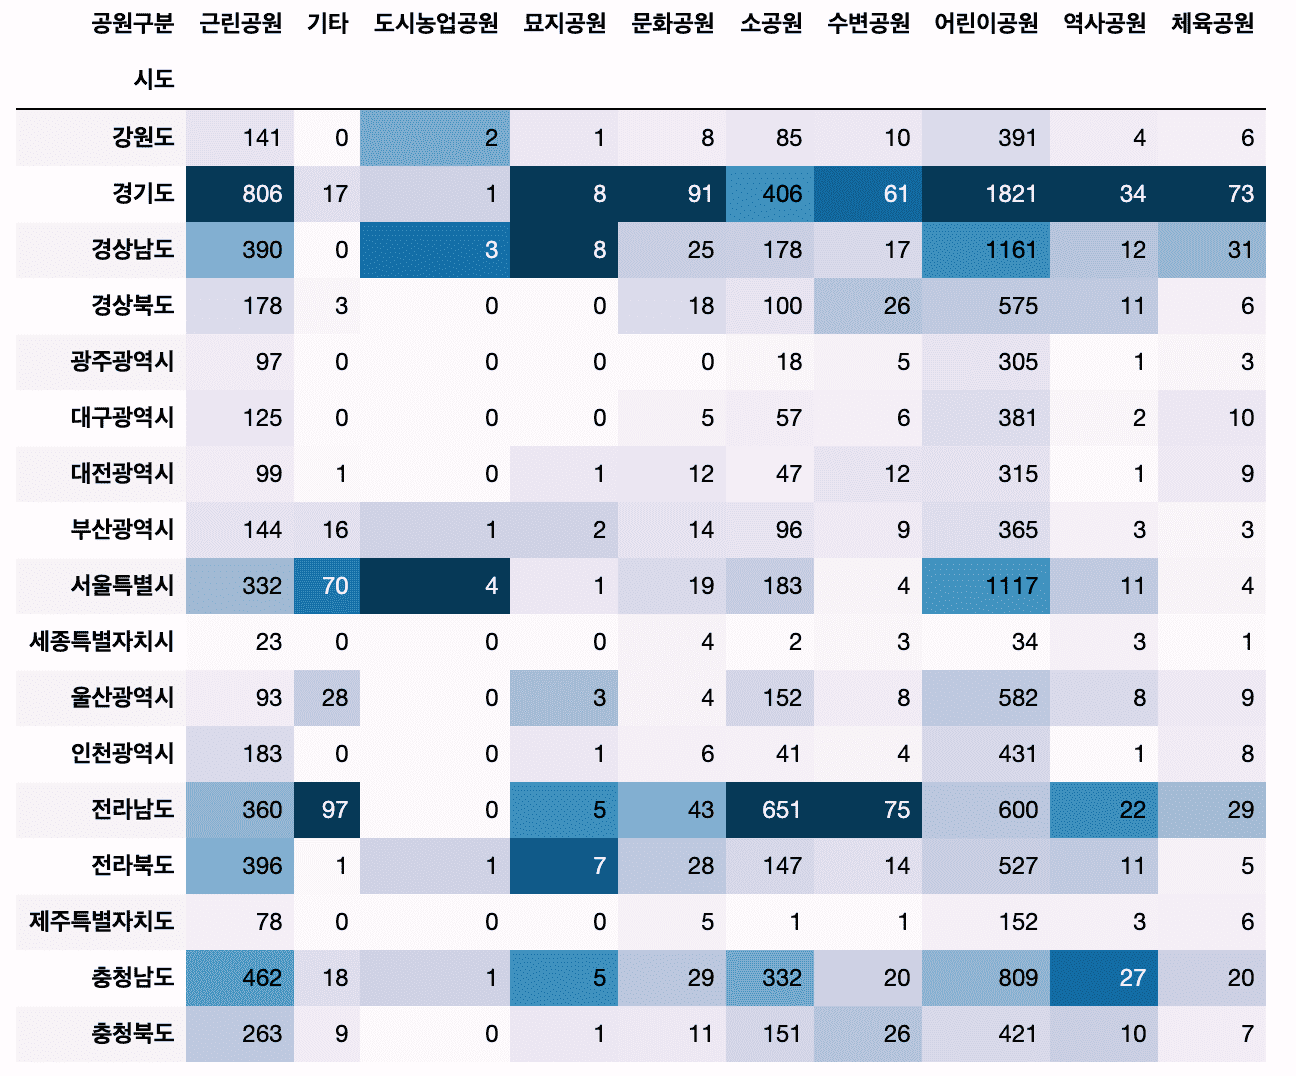
# Added a method to create a cross-tab of categorical vs. categorical data using crosstab.
Also, we will use the Pandas style function to colorize the dataframe without visualization.
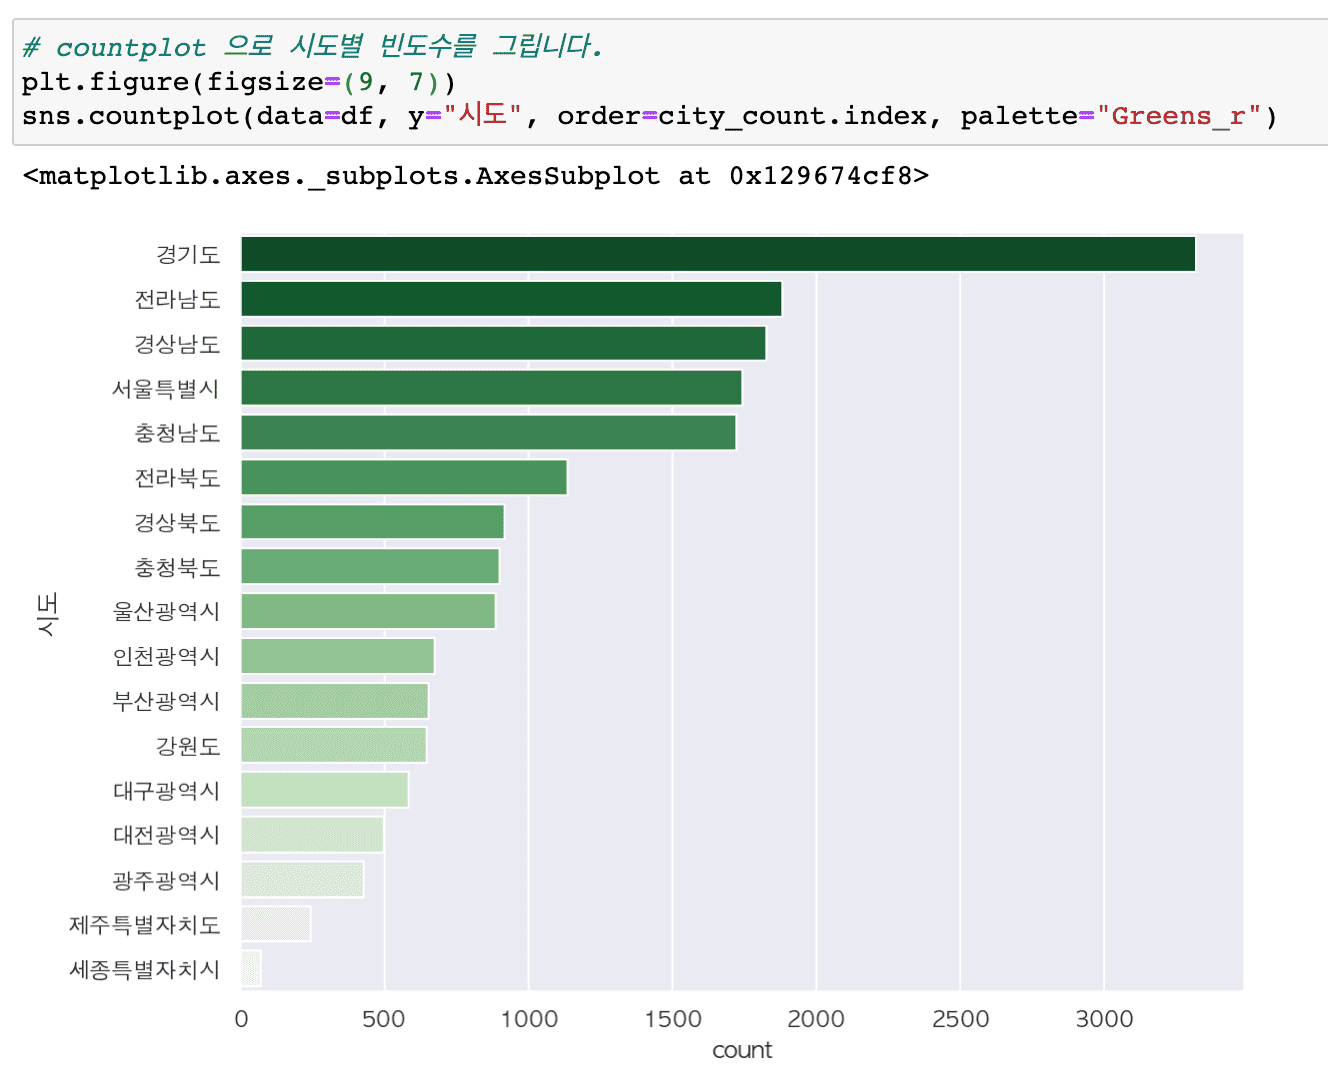
# Let's try some more diverse applications of visualization techniques.
Summary of major updates
# Pandas Profiling
- Generate various descriptive statistics reports for all data with one line of code
# Various data preprocessing required for practical work
- Create derived variables
- Replace missing values
- Finding and handling outliers and error values
- Change data type
# Handling text data with regular expressions
- Get only the data you want
- Extract only keywords from other types of text and count their frequency
- Draw a word cloud
- Create text data preprocessing functions for code reuse
- Masking information: Find and mask patterns in personal information or phone numbers, emails, and car registration numbers.
# Numeric vs. categorical variables
- Find numeric and categorical variables by data type
- Using pivot_table vs crosstab
# Find parks near me and show them on a map
- Data preprocessing and visualization through folium
If you leave a good review, it will be a great help in reorganizing and improving the course!
thank you

Analysis of commercial property (commercial area) information has become much more detailed.
Following the renewal of Chapter 1 , Chapters 2 to 4 have also been renewed. All videos and source codes have been rewritten.
<Before renewal>

<After renewal>

Chapter 2 29 minutes => 167 minutes
Chapter 3 37 minutes => 101 minutes
Chapter 4 91 minutes => 113 minutes
We've received valuable questions and feedback over the past year, which has helped us improve the content and add much more detailed explanations .
We also provide files for practice and result files, as well as a link to practice directly on Google Colaboratory.
<Chapter 2: Learning technical statistics using commercial (commercial) information>
Visualize missing values in more ways with missingno.
We also discuss how memory usage can be reduced by looking at how removing missing values affects memory usage.
Additional content has been added to analyze restaurants by district and to hypothesize and analyze whether there are many cram schools in Daechi-dong and Mok-dong .
And we have significantly supplemented the technical statistics content .
When summarizing numerical and categorical data through describe, a process of calculating the meaning of each value and individual values separately has been added.
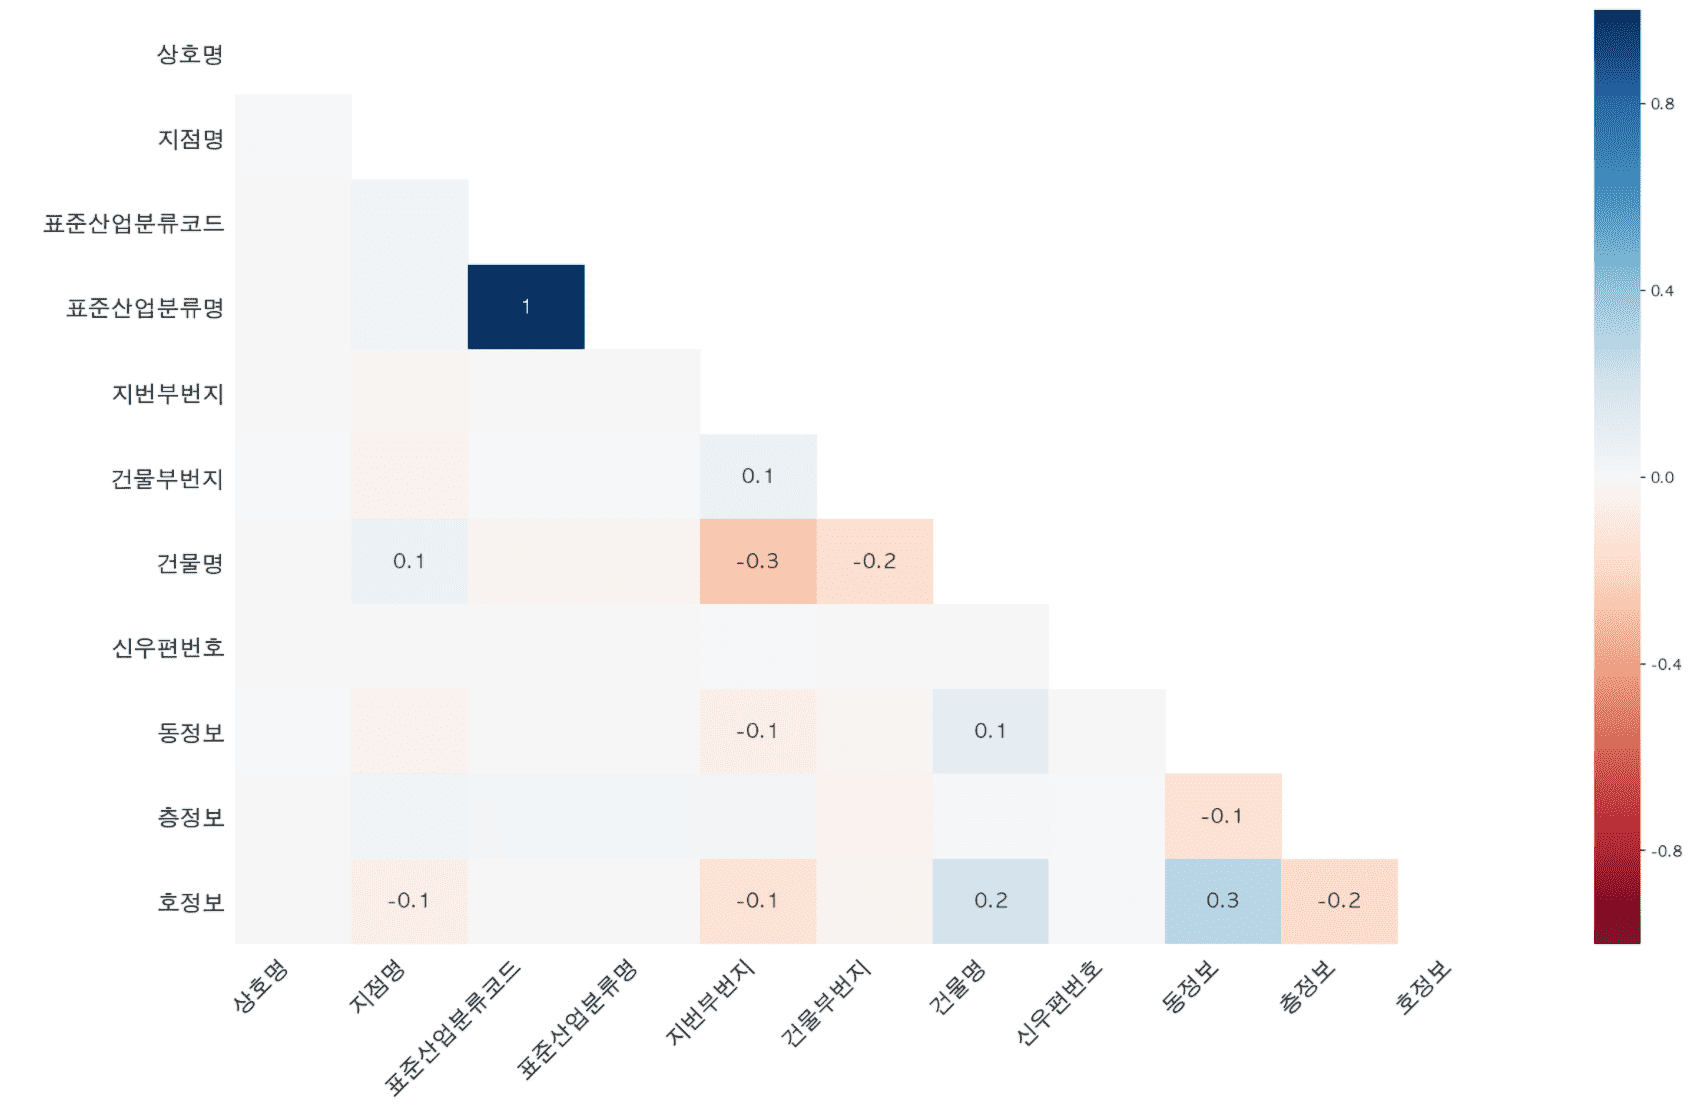
Contents on calculating correlation coefficients and drawing regression lines to perform correlation analysis have also been added.
<Chapter 3 Franchise Entry Analysis>
We'll go into more detail about visualizing multiple variables and how to visualize two numeric variables using jointplot .
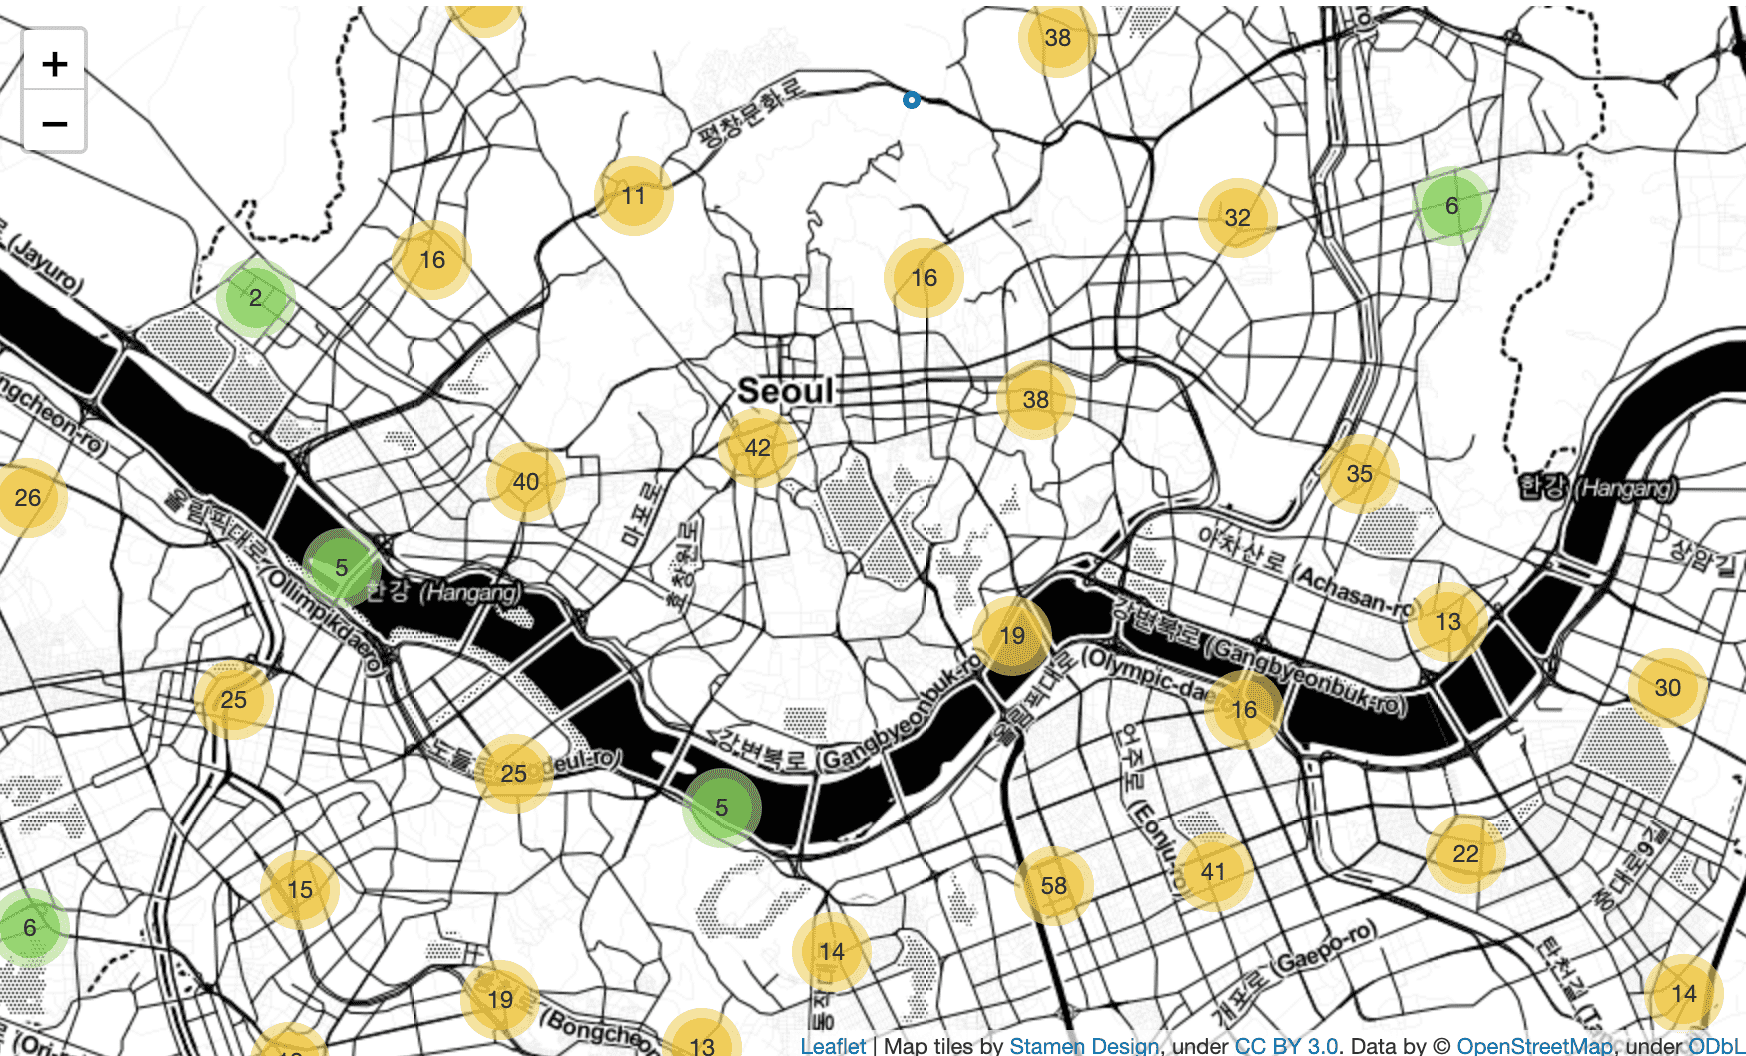
In addition to Folium's CircleMarker , MarkerCluster and Heatmap are used to express the density of stores by location.
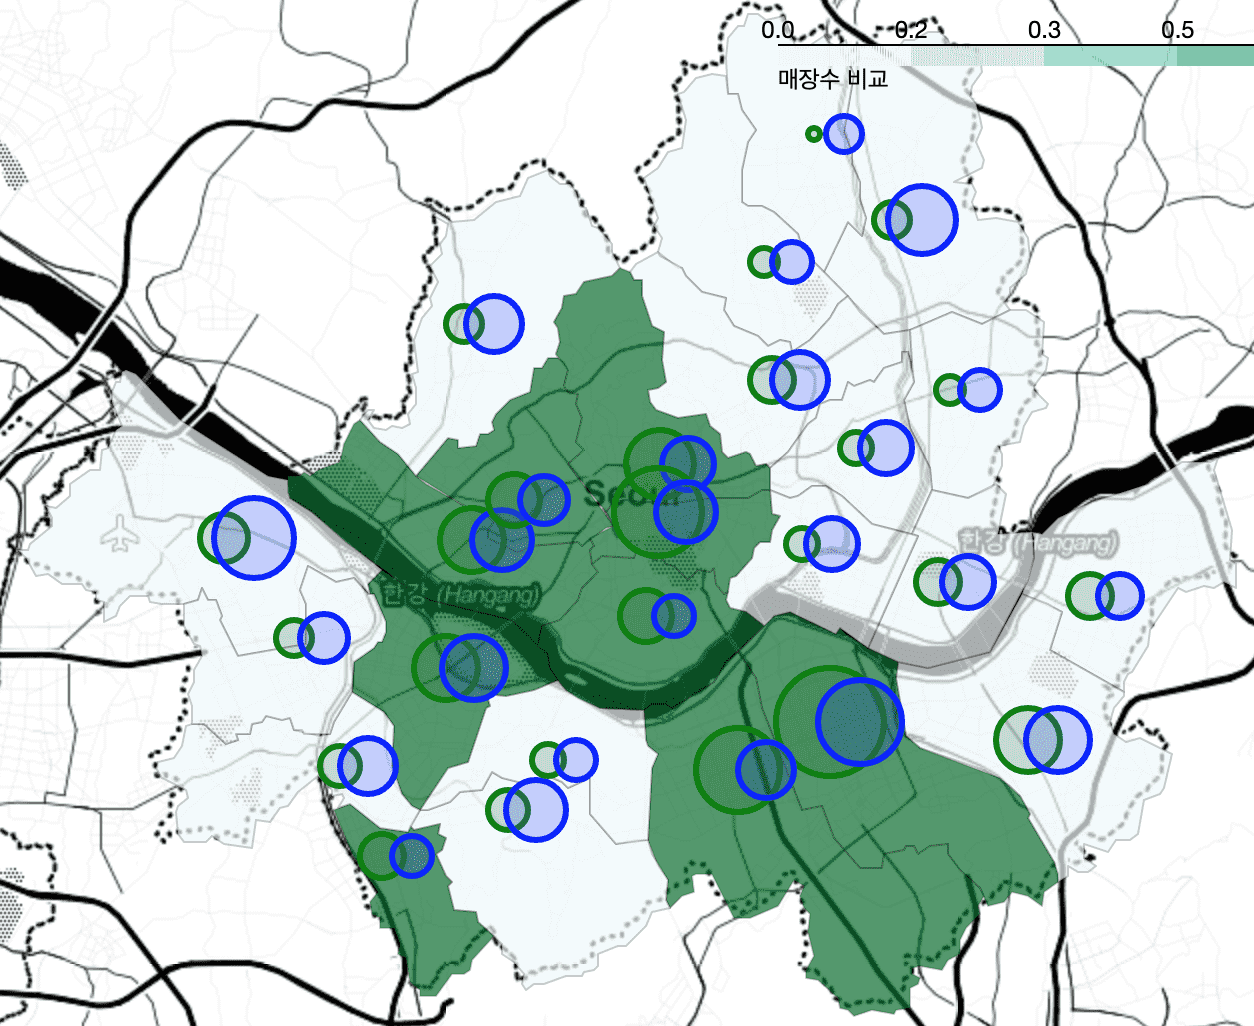
<Chapter 4 Comparing Starbucks and Ediya store locations>
The process of calculating the average of latitude and longitude to draw CircleMarker as a distinction is covered by calculating it through pivot_table without using a for loop and merging the calculation results through merge . Also, the explanation has become much more detailed.
<Chapter 5> will also be renewed soon!
I think it would be helpful for me to create better lectures if you would leave your opinions through questions or course reviews in the future!
I look forward to your course reviews and feedback :)
We collected valuable feedback received over the past year and published it in March 2020.
The existing “Chapter 1 Nationwide New Private Apartment Sales Price Trends” has been completely renewed.
As of Chapter 1, the explanations and visualizations have become much more detailed, from 9 videos (1 hour and 41 minutes) to 20 videos (3 hours and 25 minutes) .
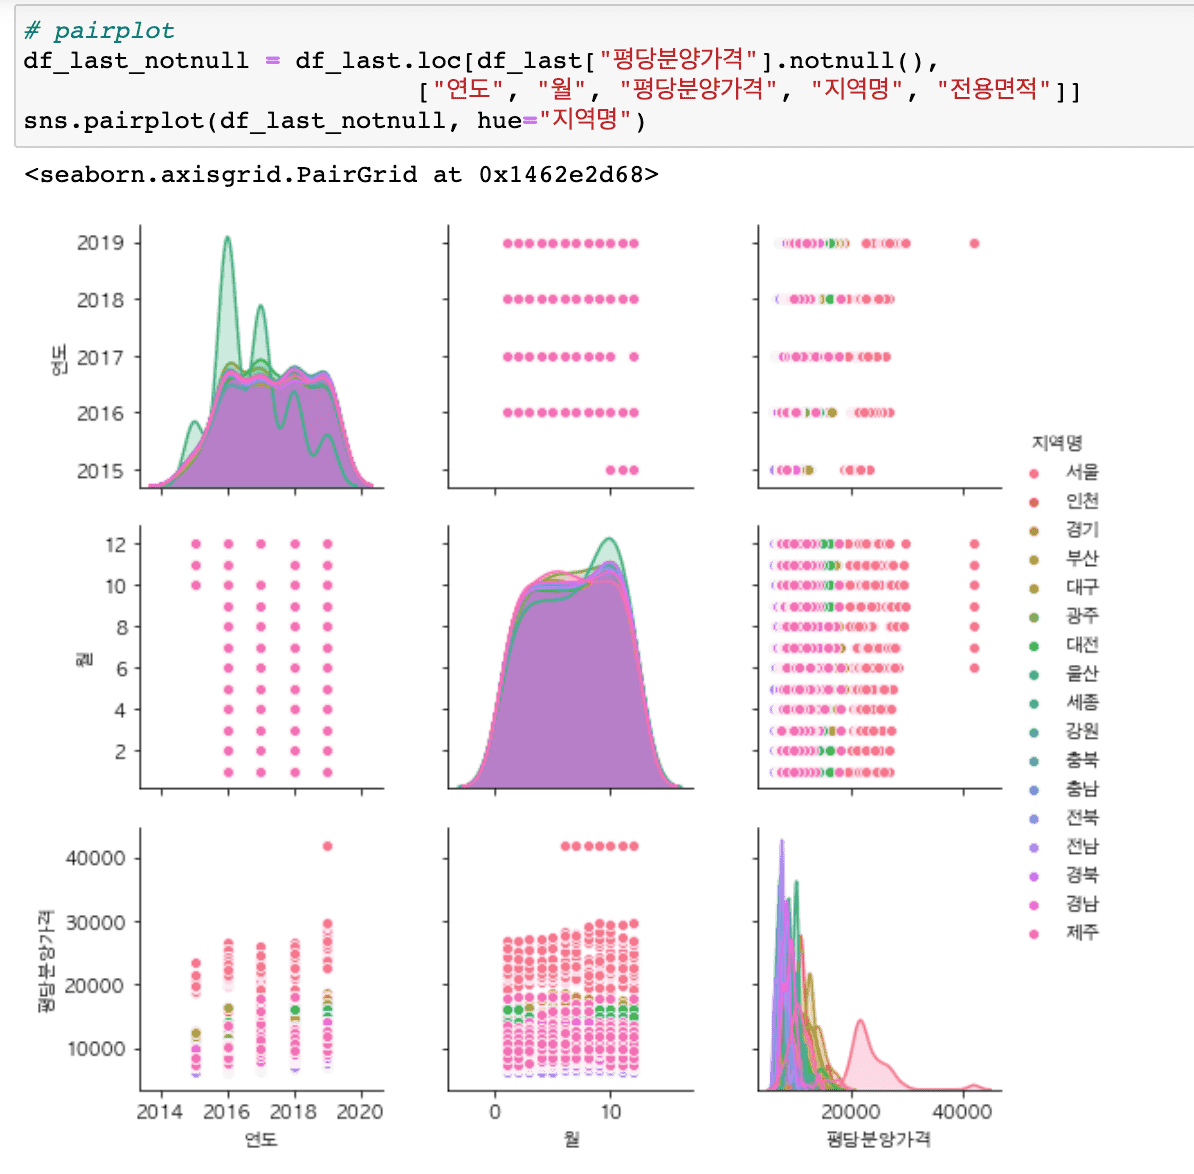
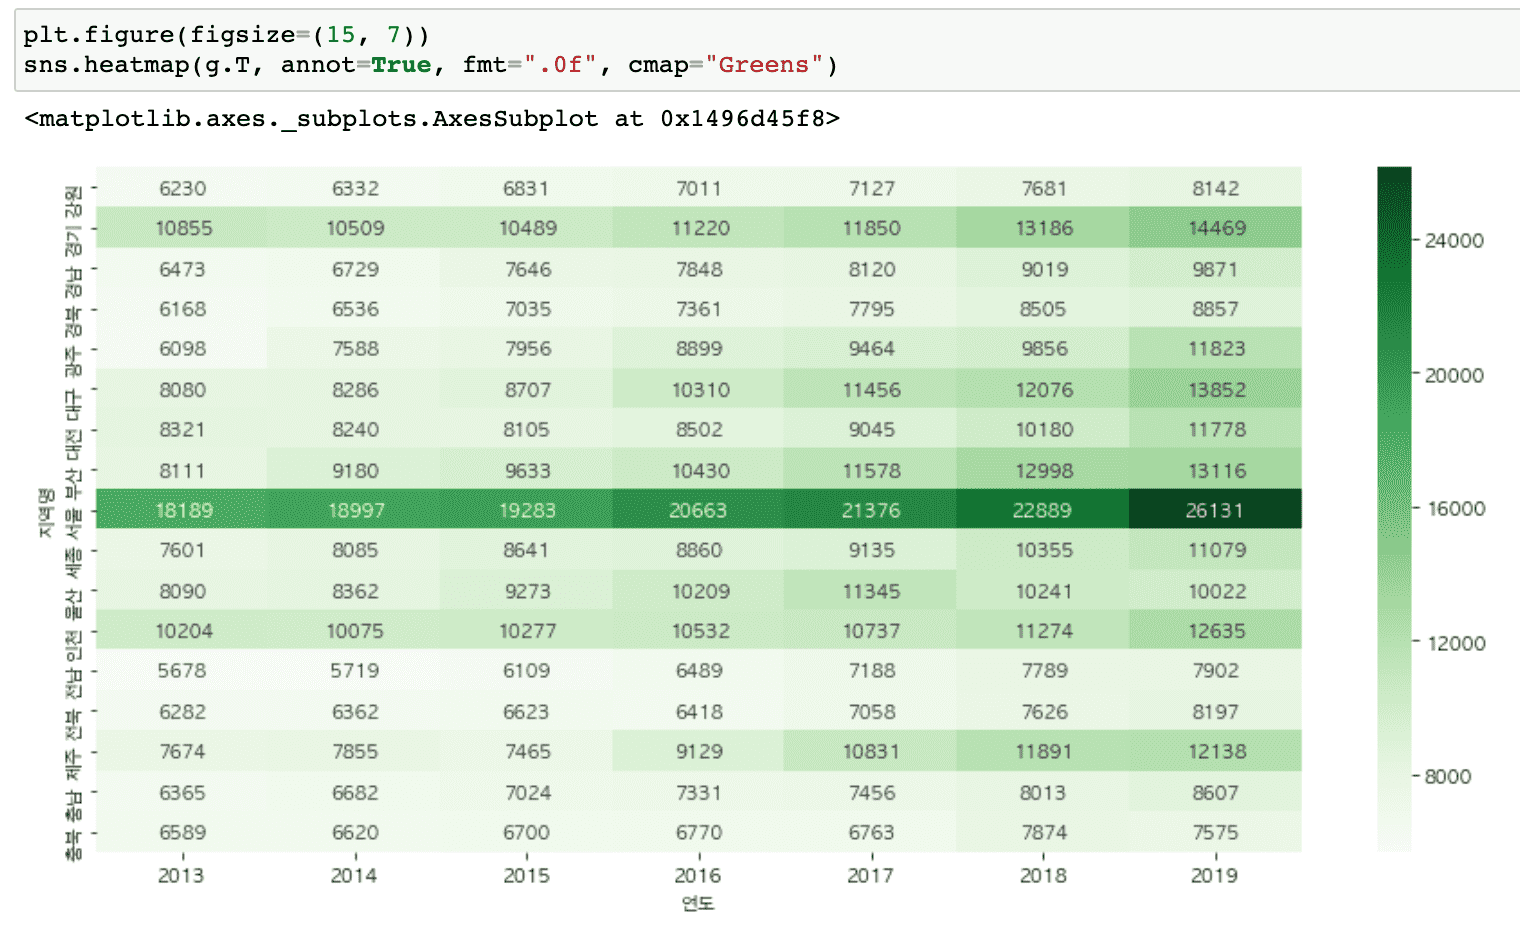
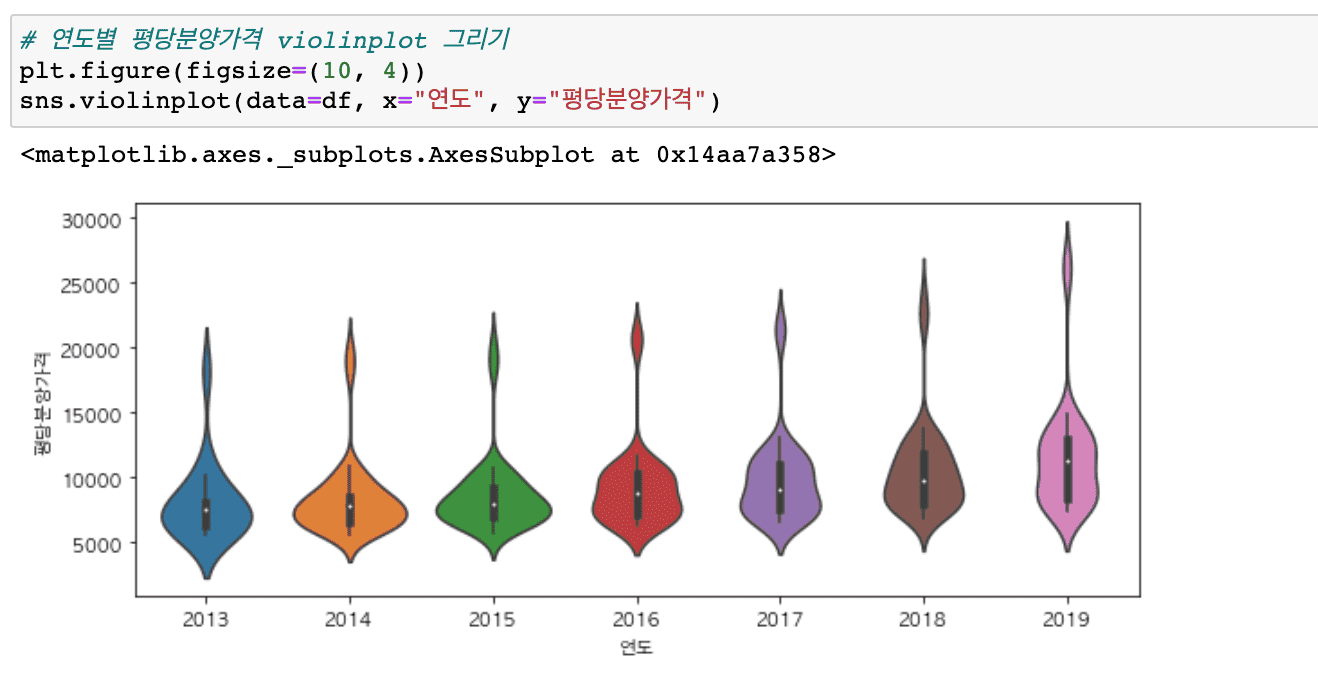
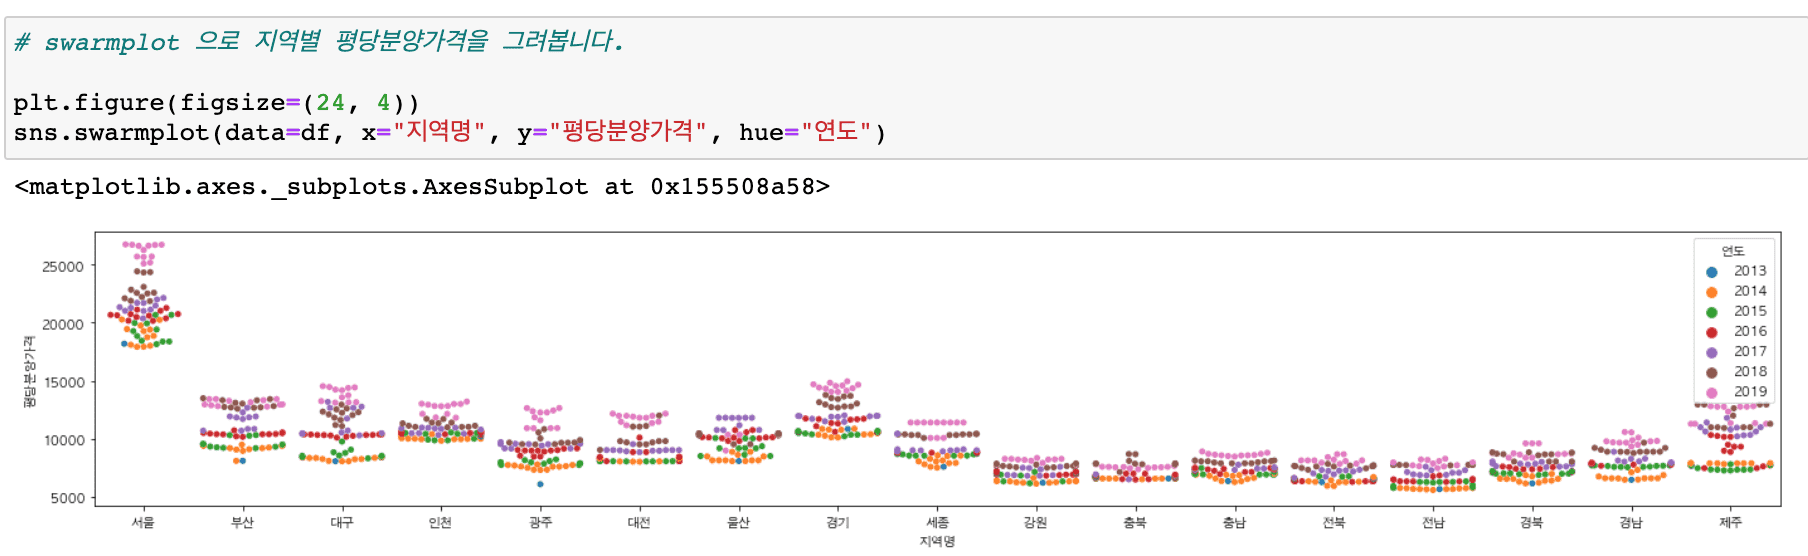
It covers a wider variety of graphs than before (heatmaps, histograms, distributions, scatter plots, regression graphs, etc.) and includes content that makes it easy to draw subplots.
We also provide practice code and result code.
Try using the practice file ( 01-apt-price-input.ipynb ) that provides a simple guide to follow along with the code while watching the video, and the file (01-apt-price-output.ipynb) that displays the results .
Please refer to the video introduction for the code location and google colaboratory path!
Tutorials for other chapters will also be renewed in March 2020!
thank you