
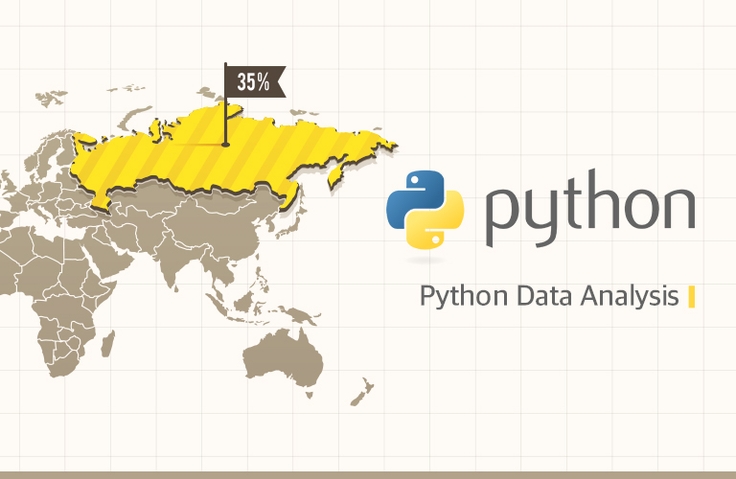
Getting started with Python data analysis using public data
There was a rumor that Ediya would open a store near Starbucks. How different would the locations of Ediya and Starbucks be? Will the real estate price fluctuation trend from 2013 to 2019 be reflected in the apartment sales price? What kind of parks are there in my neighborhood? How can I utilize the data in the public data portal? The goal is to become familiar with Python and various data analysis libraries by handling various types of data through public data.
[Reorganization Notice] All content of Getting Started with Python Data Analysis with Public Data has been completely revamped. (Previously 5 hours 33 minutes => 13 hours 52 minutes)
hello.
📊 The course “Getting Started with Python Data Analysis Using Public Data” has been completely renewed .
Following Chapters 1 to 4, [Chapter 5: Analysis of Standard Data in Urban Parks] has reorganized the course to focus on data preprocessing.
✍🏻Both the code and the video have been rewritten .
📈[Chapter 5] Content on data preprocessing has been significantly increased from 55 minutes to 217 minutes .
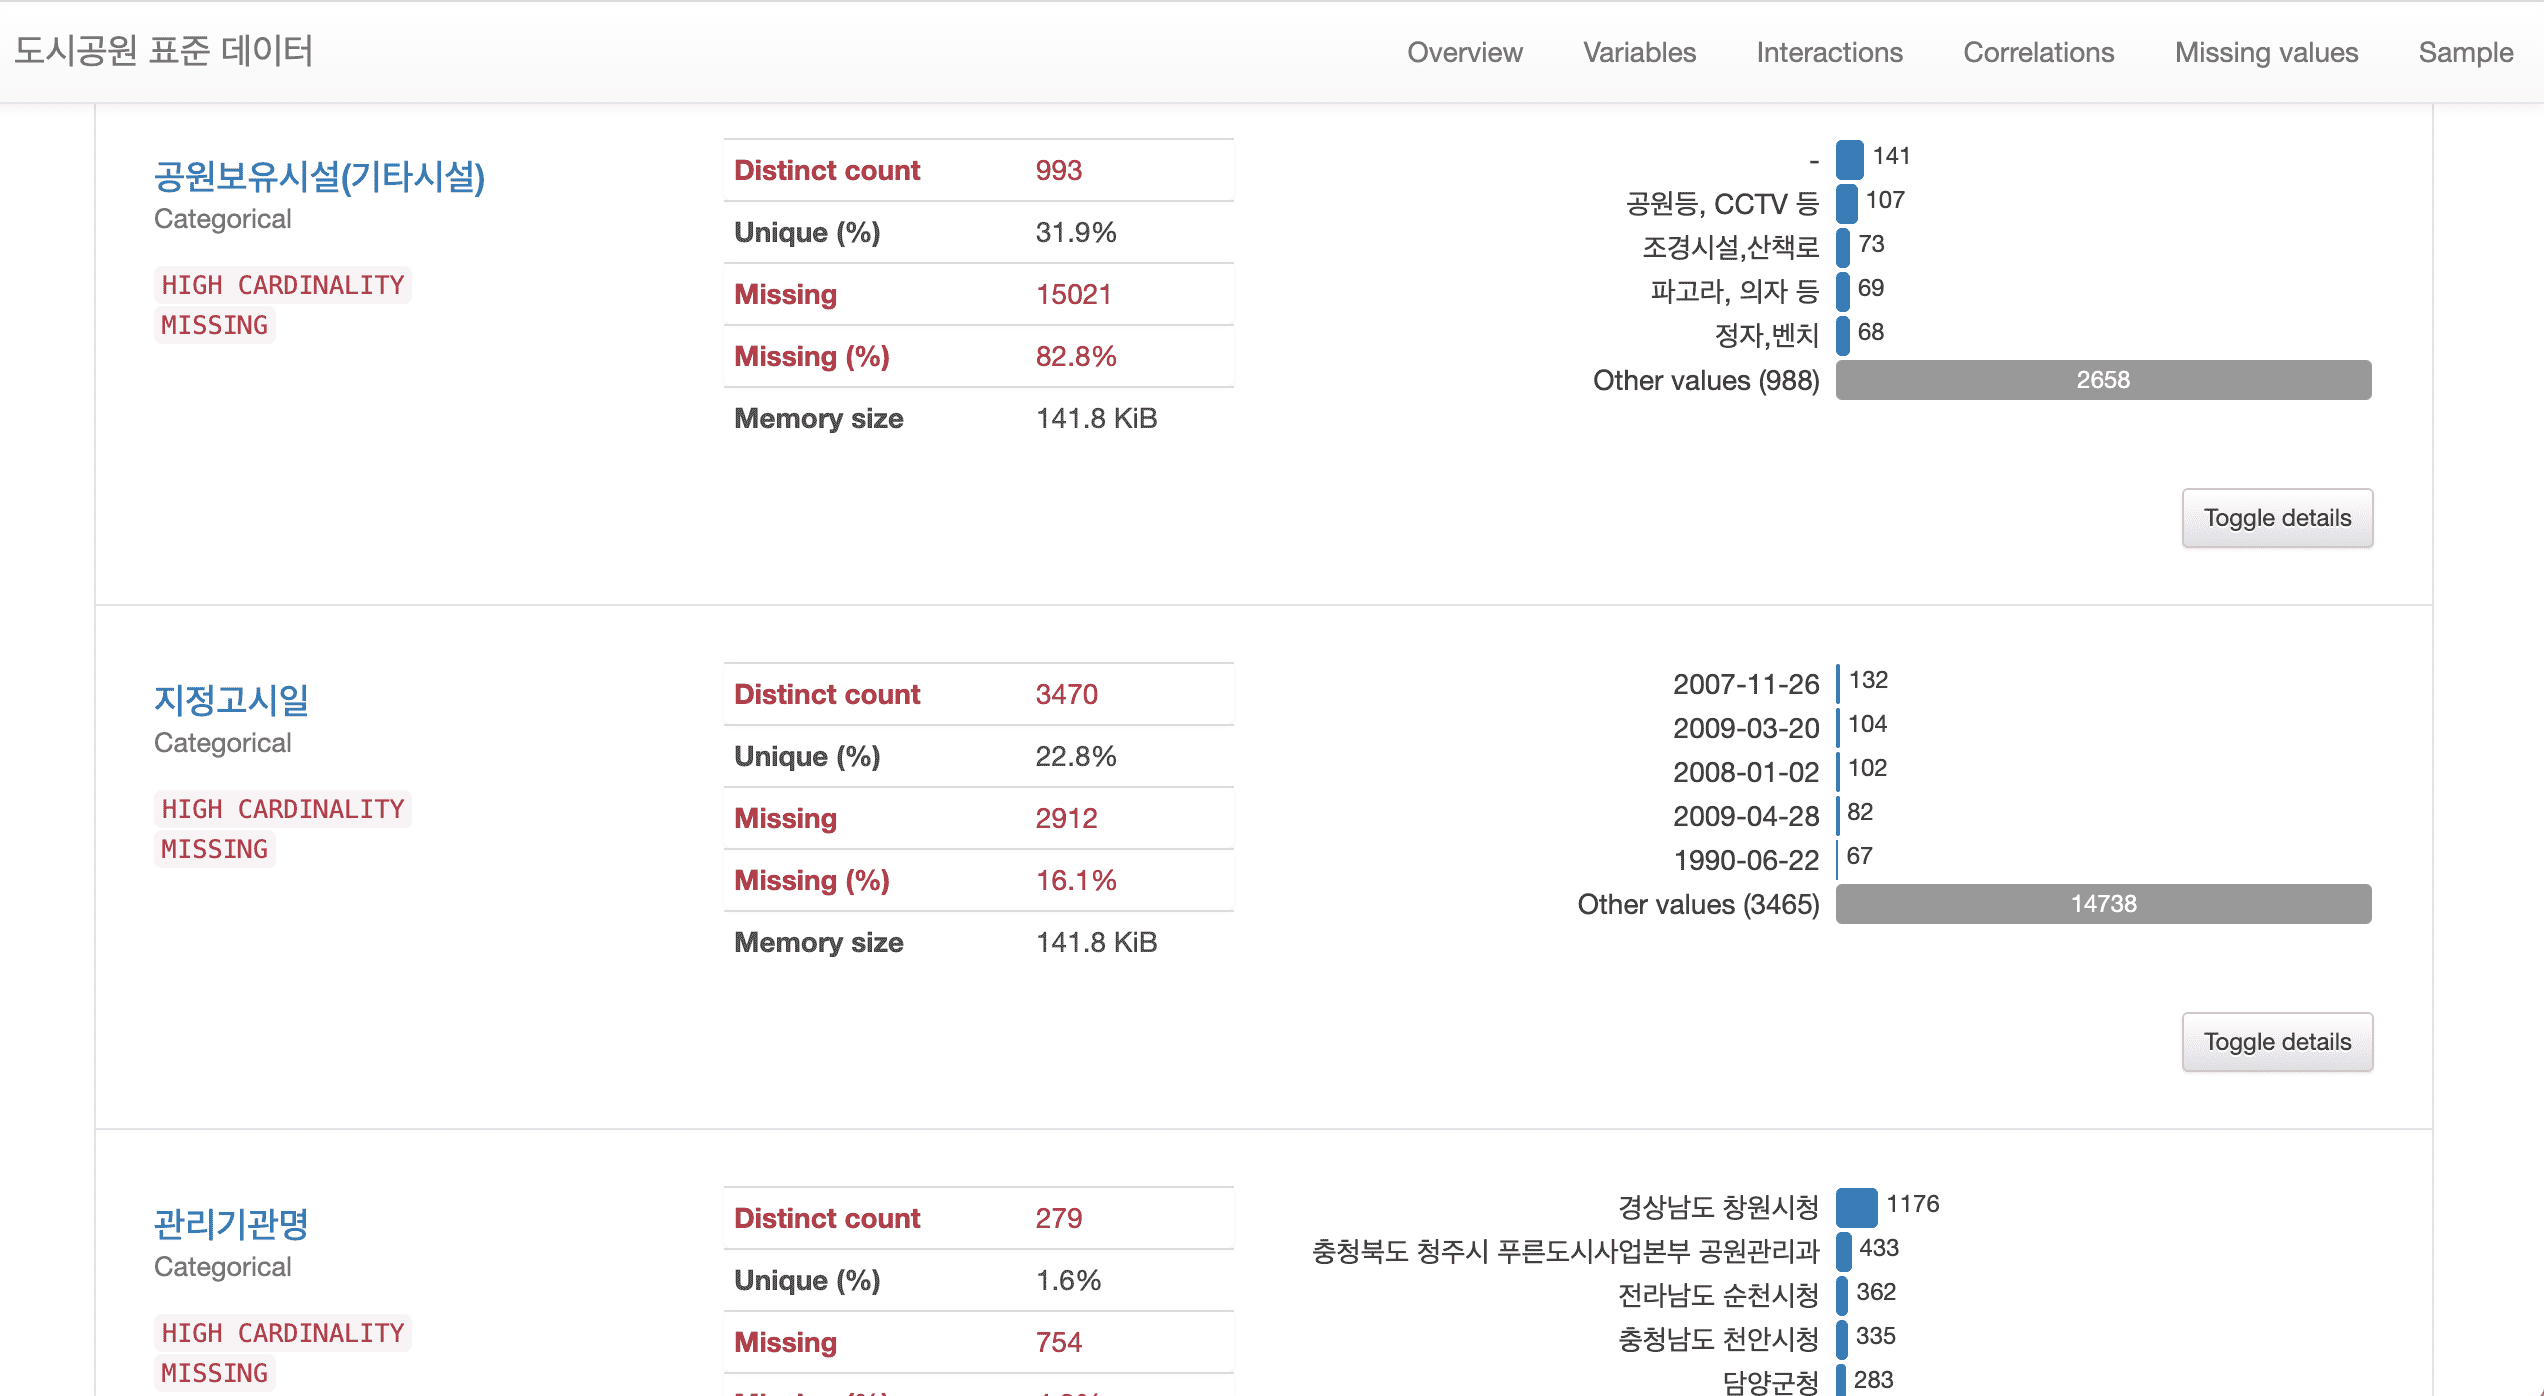
# The city park standard data requires various data preprocessing such as missing values, outliers, error values, and dates, so I think it would be suitable for those who want to learn preprocessing through real data.
# Added a method to generate reports using Pandas Profiling, which allows for easy and powerful technical statistical analysis using various libraries.
# A method for preprocessing text data using regular expressions has been added. In addition, text data can be visualized in various ways.

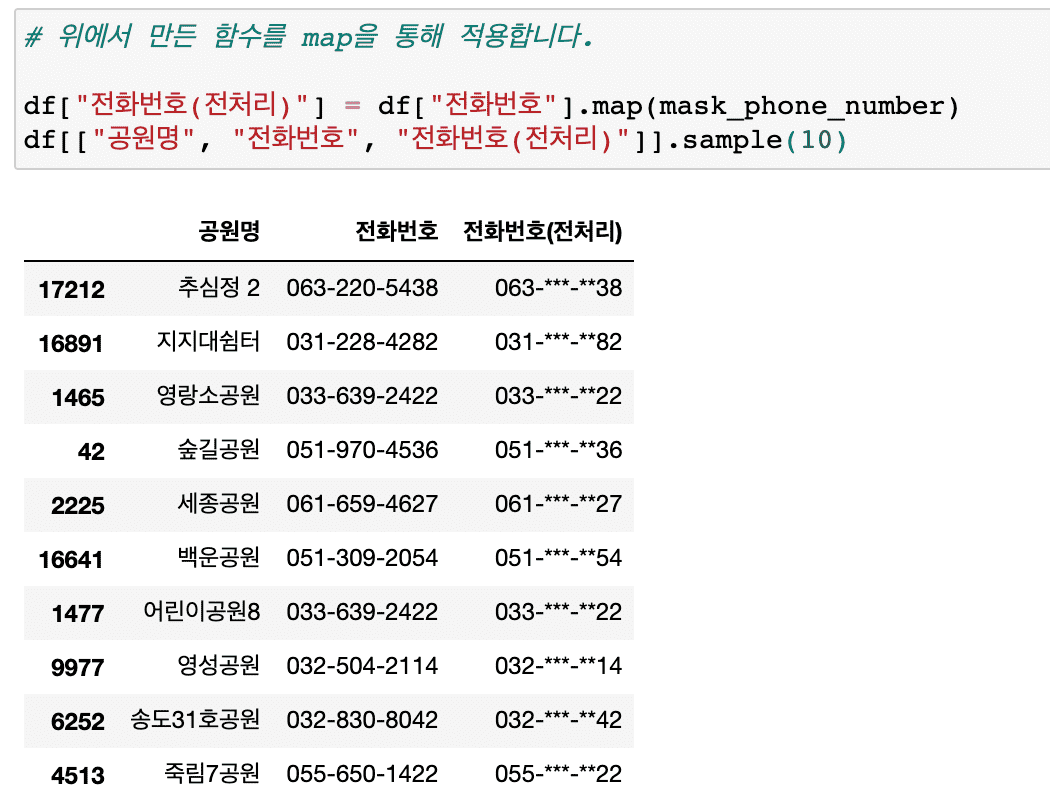
# Information masking techniques essential for personal information protection, etc. have been added.
In this lecture on analyzing the distribution of existing urban parks, we have significantly supplemented the content on various techniques that can be frequently encountered in preprocessing work.
In particular, new content has been added so that you can learn about text preprocessing and analysis using regular expressions .
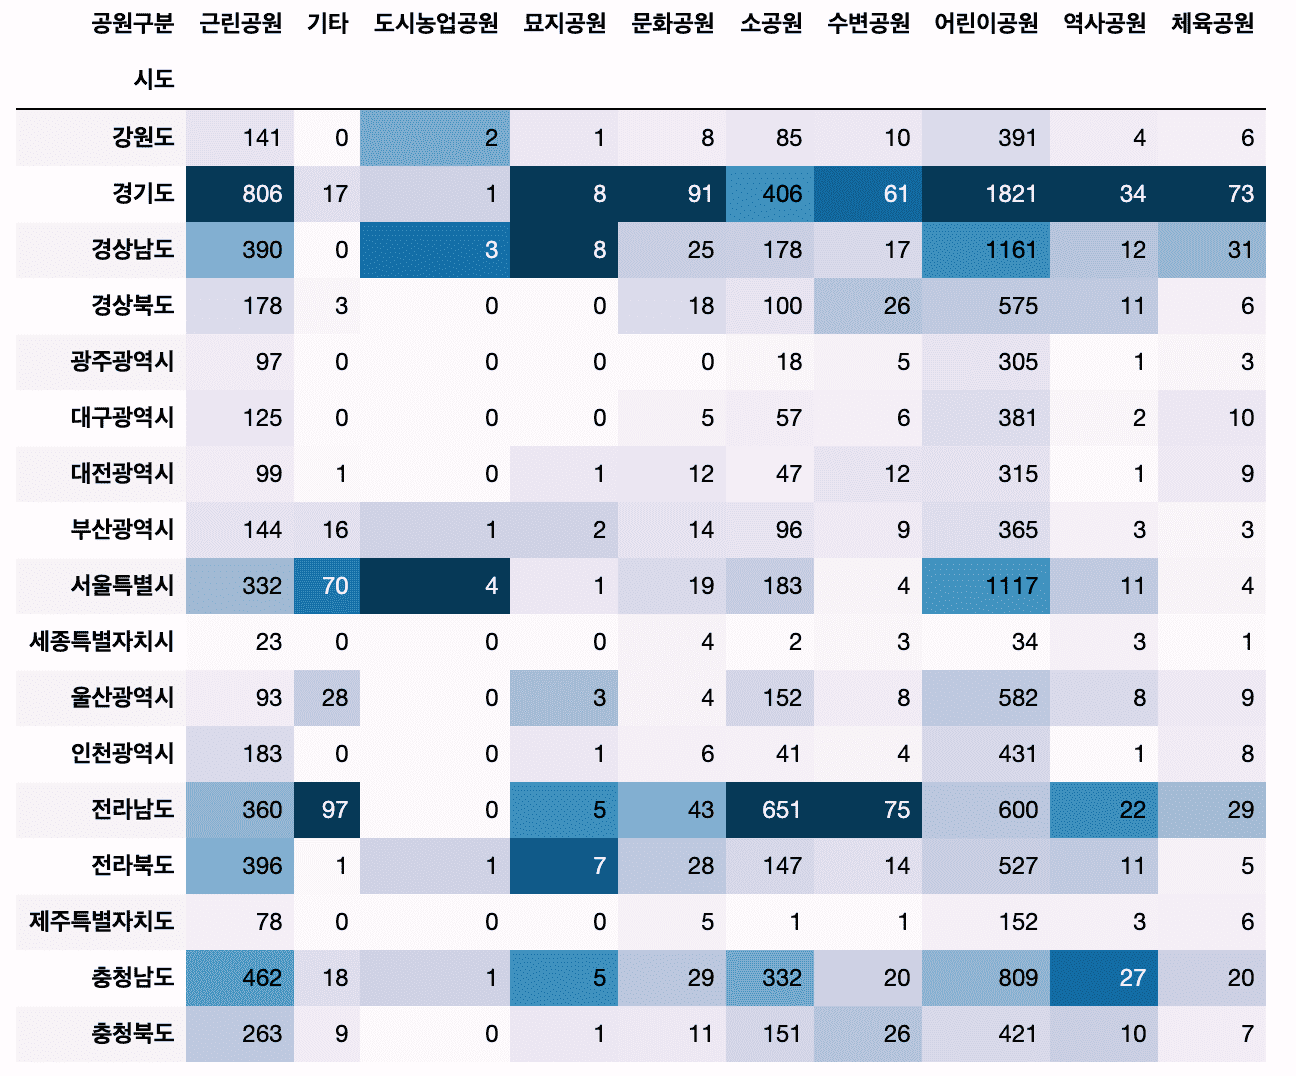
# Added a method to create a cross-tab of categorical vs. categorical data using crosstab.
Also, we will use the Pandas style function to colorize the dataframe without visualization.
# Let's try some more diverse applications of visualization techniques.
Summary of major updates
# Pandas Profiling
- Generate various descriptive statistics reports for all data with one line of code
# Various data preprocessing required for practical work
- Create derived variables
- Replace missing values
- Finding and handling outliers and error values
- Change data type
# Handling text data with regular expressions
- Get only the data you want
- Extract only keywords from other types of text and count their frequency
- Draw a word cloud
- Create text data preprocessing functions for code reuse
- Masking information: Find and mask patterns in personal information or phone numbers, emails, and car registration numbers.
# Numeric vs. categorical variables
- Find numeric and categorical variables by data type
- Using pivot_table vs crosstab
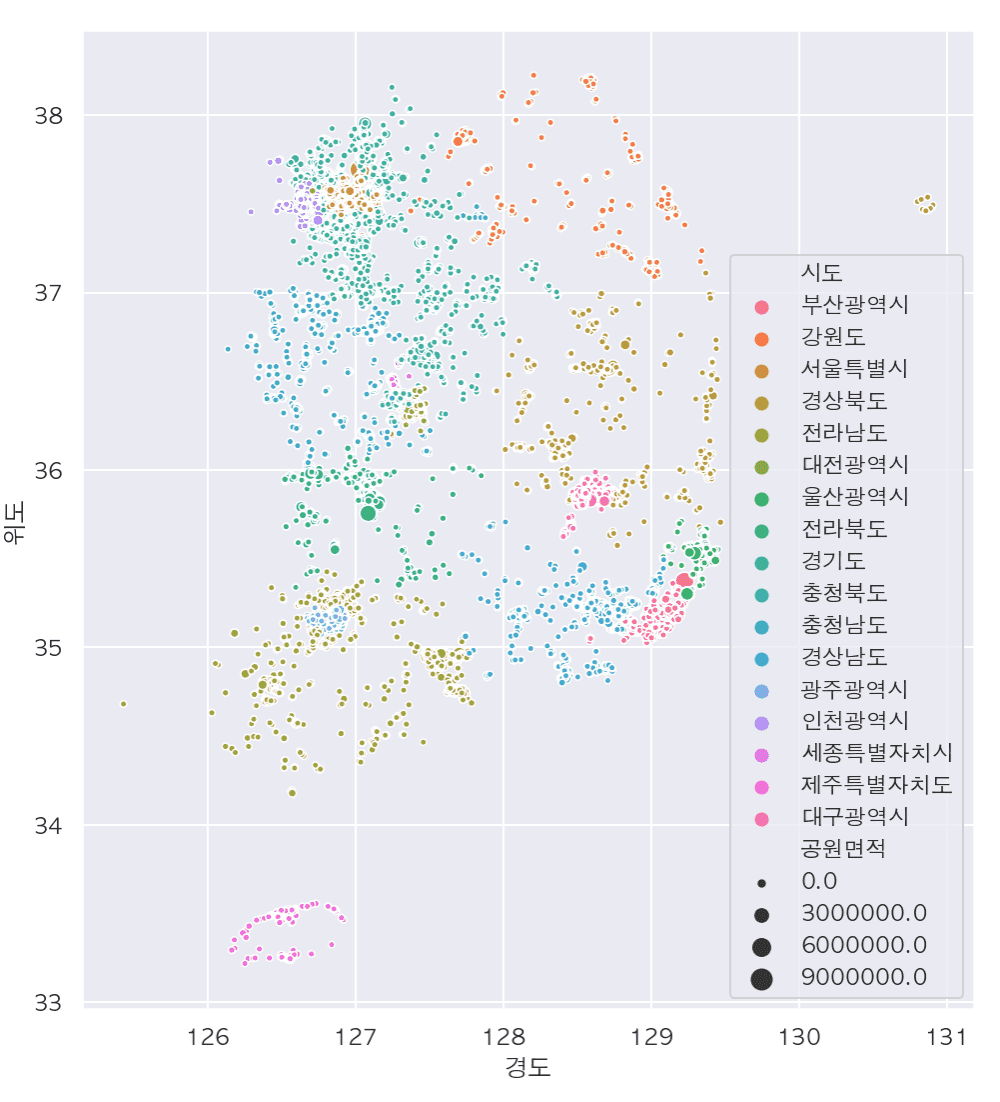
# Find parks near me and show them on a map
- Data preprocessing and visualization through folium
If you leave a good review, it will be a great help in reorganizing and improving the course!
thank you
