
Getting started with Python data analysis using public data
There was a rumor that Ediya would open a store near Starbucks. How different would the locations of Ediya and Starbucks be? Will the real estate price fluctuation trend from 2013 to 2019 be reflected in the apartment sales price? What kind of parks are there in my neighborhood? How can I utilize the data in the public data portal? The goal is to become familiar with Python and various data analysis libraries by handling various types of data through public data.
The analysis of commercial (commercial) information has become much more detailed. Following the renewal of Chapter 1, Chapters 2 to 4 have been reorganized.
Analysis of commercial property (commercial area) information has become much more detailed.
Following the renewal of Chapter 1 , Chapters 2 to 4 have also been renewed. All videos and source codes have been rewritten.
<Before renewal>

<After renewal>

Chapter 2 29 minutes => 167 minutes
Chapter 3 37 minutes => 101 minutes
Chapter 4 91 minutes => 113 minutes
We've received valuable questions and feedback over the past year, which has helped us improve the content and add much more detailed explanations .
We also provide files for practice and result files, as well as a link to practice directly on Google Colaboratory.
<Chapter 2: Learning technical statistics using commercial (commercial) information>
Visualize missing values in more ways with missingno.
We also discuss how memory usage can be reduced by looking at how removing missing values affects memory usage.
Additional content has been added to analyze restaurants by district and to hypothesize and analyze whether there are many cram schools in Daechi-dong and Mok-dong .
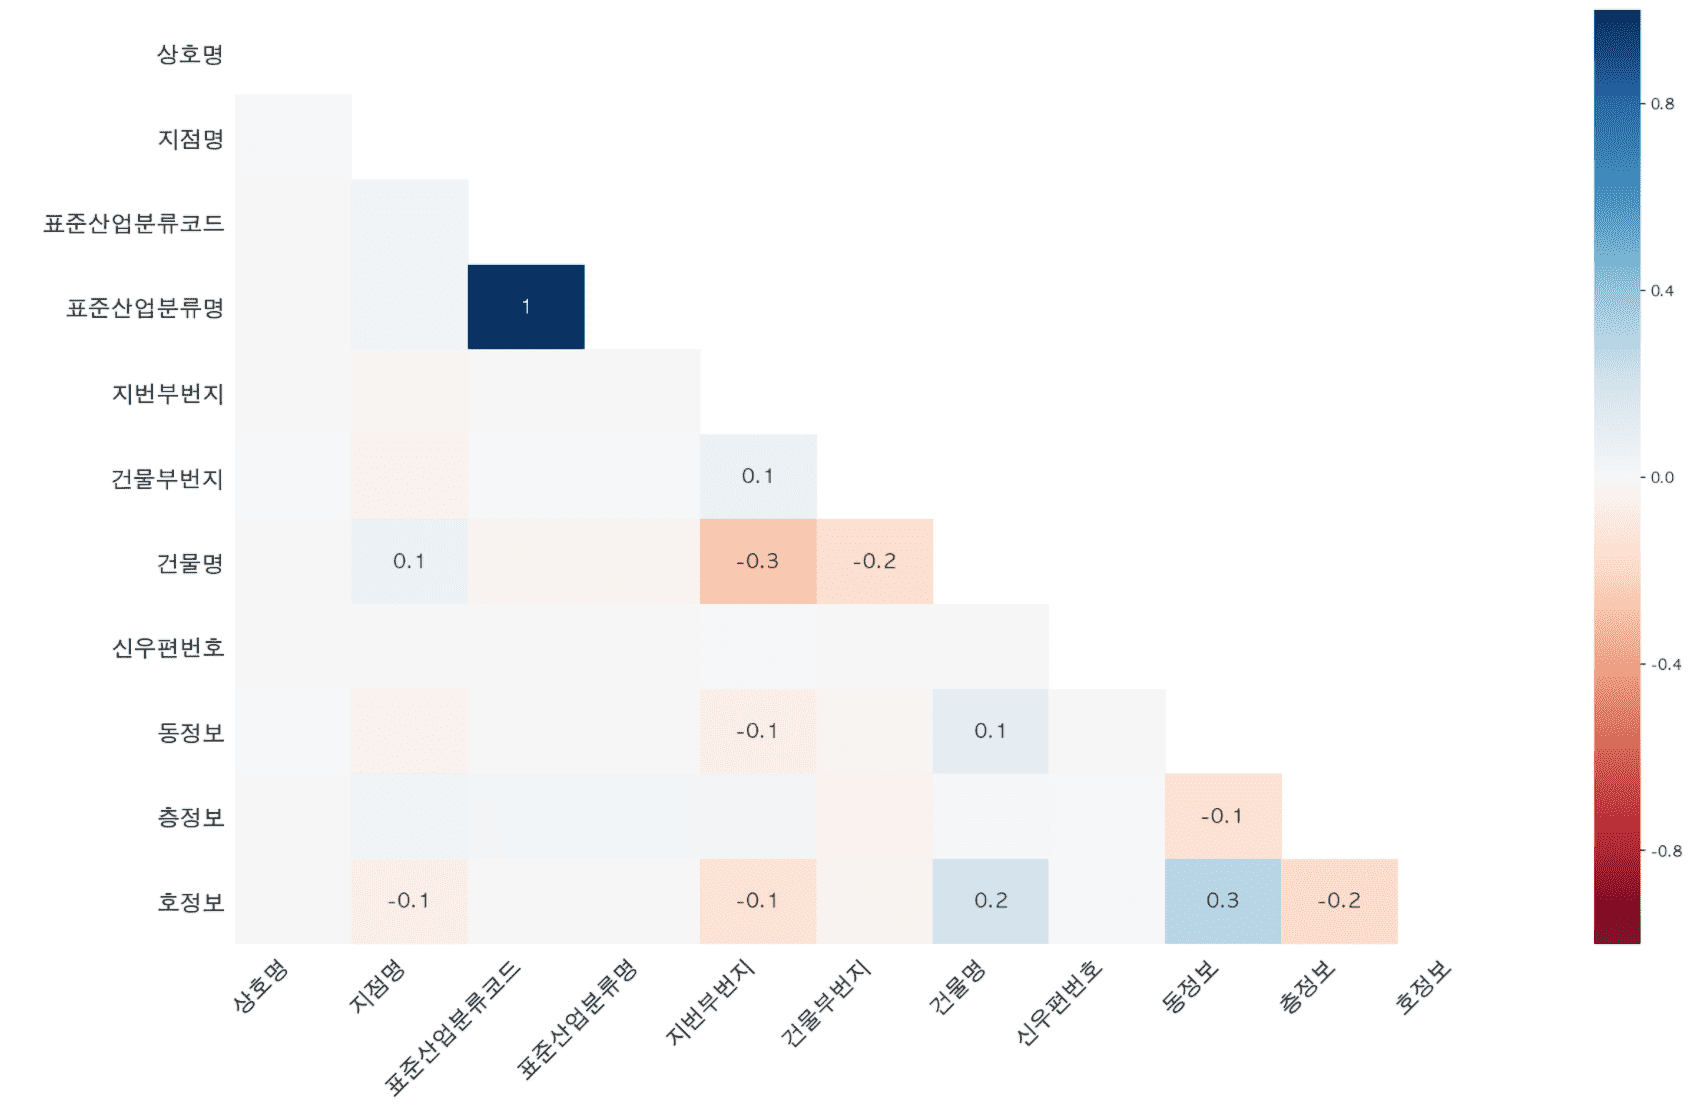
And we have significantly supplemented the technical statistics content .
When summarizing numerical and categorical data through describe, a process of calculating the meaning of each value and individual values separately has been added.
Contents on calculating correlation coefficients and drawing regression lines to perform correlation analysis have also been added.
<Chapter 3 Franchise Entry Analysis>
We'll go into more detail about visualizing multiple variables and how to visualize two numeric variables using jointplot .
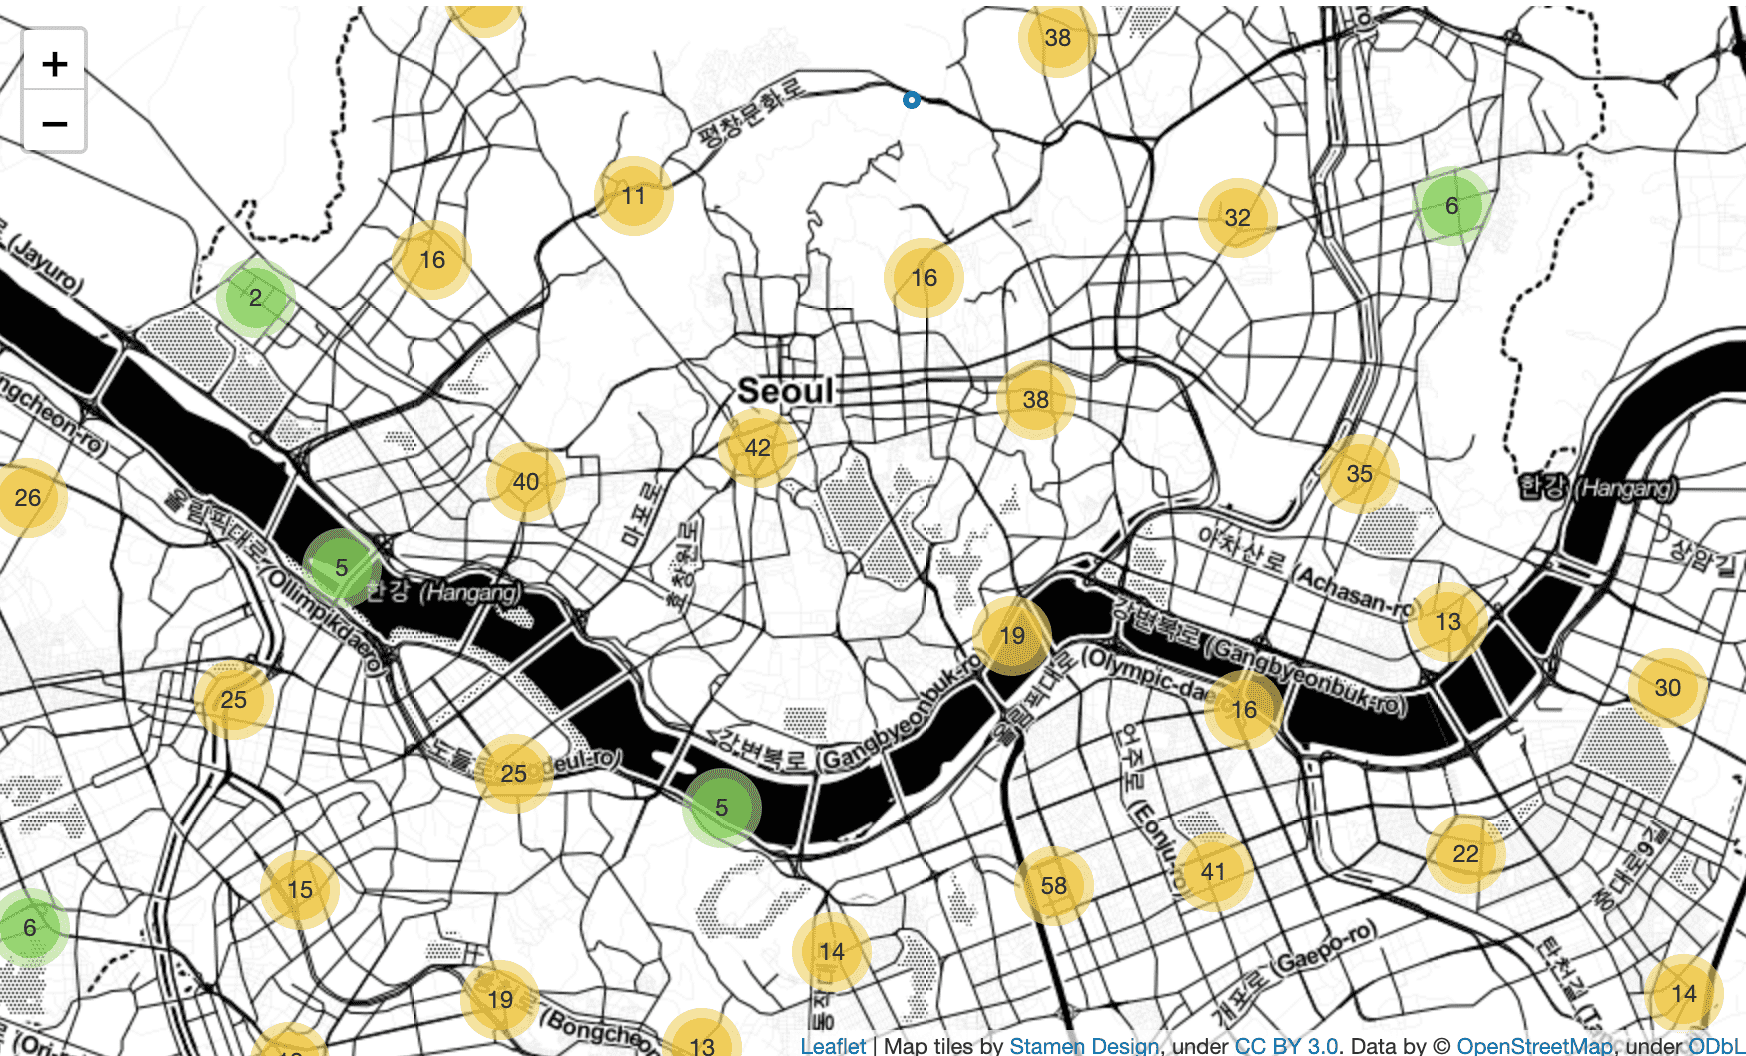
In addition to Folium's CircleMarker , MarkerCluster and Heatmap are used to express the density of stores by location.
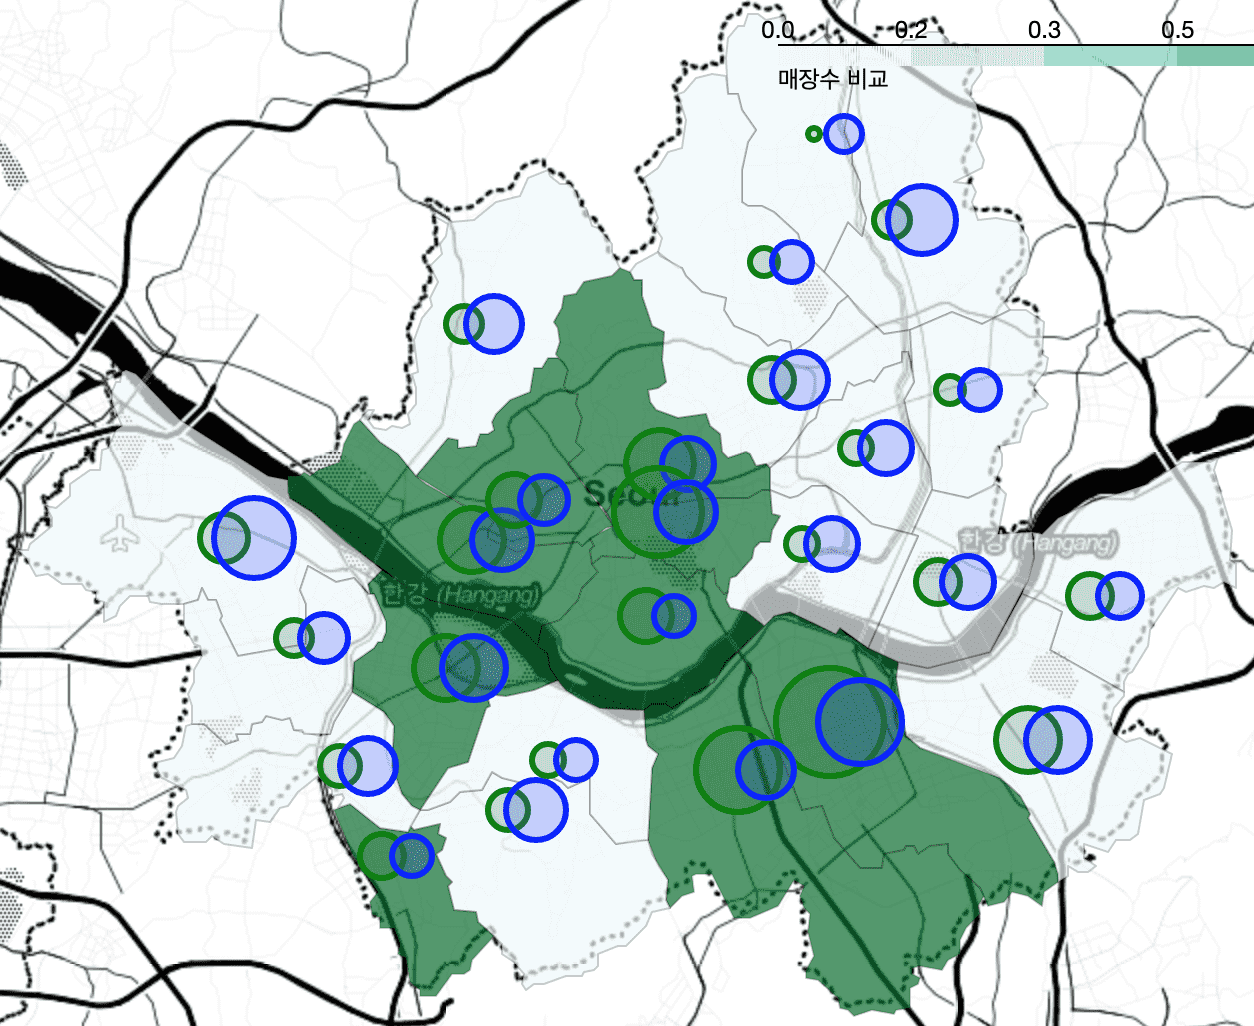
<Chapter 4 Comparing Starbucks and Ediya store locations>
The process of calculating the average of latitude and longitude to draw CircleMarker as a distinction is covered by calculating it through pivot_table without using a for loop and merging the calculation results through merge . Also, the explanation has become much more detailed.
<Chapter 5> will also be renewed soon!
I think it would be helpful for me to create better lectures if you would leave your opinions through questions or course reviews in the future!
I look forward to your course reviews and feedback :)